If your funds are within 50,000, and you want to achieve quick success in the cryptocurrency market through short-term trading, then please read this post carefully. After reading it, I believe you will have a sudden insight into the essence of short-term trading!
I was born in 1987 and have been in the cryptocurrency market for 11 years, trading cryptocurrencies full-time to support my family for 5 years!
Not choosing a finance or computer science major in college is one of my life's biggest regrets. I started engaging with Bitcoin and blockchain online quite early; the enticing K-line charts and disruptive ideas captivated me. With an infinite longing for the crypto world, I participated in trading early on, thus beginning this journey filled with challenges and opportunities.
Like most friends who have just entered the market, at first, they are fascinated by various technical indicators and on-chain data, constantly backtesting, trying to find the 'holy grail'; eager to buy low-priced altcoins or those that have already dropped over 90%+ 'value coins', believing that their 'margin of safety' is higher. The harsh reality tells me that most of these initial understandings of the market are incorrect and dangerous.
I later painfully realized: if you want to quickly and relatively controllably gain profits in the highly volatile cryptocurrency market that operates 24/7, focusing on short-term hot trend strategies is almost the only feasible path (for small funds). The core of short-term trading is to identify the dominant narrative pathways in the market and accurately grasp the sentiment cycles. The dominant narrative breeds leading cryptocurrencies, and the crazy rise of leading cryptocurrencies in turn reinforces and spreads that narrative. What contributes most significantly to your account and has the highest efficiency is often to seize those leading cryptocurrencies in several stages. In the raging bull market, they provide the strongest explosive power; in local rebounds, they often launch first and are relatively 'anti-fall' (Note: 'safety' in the cryptocurrency market is relative!). In 2021, I also captured the most rapid main rising waves in my career through leading coins like SOL and MATIC.
For the same cryptocurrency, buying it at different stages of market sentiment and narrative cycles can lead to vastly different outcomes! The sentiment cycle tells you when to boldly attack, even leverage (cautiously!); when to hold back, or even short sell (if capable); and when to completely exit and observe. The market's main narrative tells you which direction funds are attacking (Is it AI, MEME, new public chains, or Layer 2?). This is the correct, top-down speculative approach. Unfortunately, many friends completely reverse this, going against market sentiment and facing ruthless harvesting.
There is a saying that left a deep impression on me: 'The cognitive high ground of the mind, if you do not occupy it, FUD (fear, uncertainty, doubt) and FOMO (fear of missing out) will occupy it.'
Today, I share with you this set of short-term survival and attack strategies in the cryptocurrency market, which supports my survival and continuous profitability in this market that is bloodier, faster, and more unpredictable than the stock market. If you can calm down to understand, practice, and eventually internalize it, your understanding of 'trading cryptocurrencies' will surely undergo a dramatic change!
Keep up with Bitcoin's price movements.
Bitcoin is known as the barometer of the cryptocurrency market; the rise and fall of most small coins are affected by it. For instance, Ethereum, which has a strong conceptual logic, may occasionally deviate from Bitcoin to form a one-sided market, but other altcoins generally find it hard to escape Bitcoin's 'control'. Therefore, closely monitoring Bitcoin's trading fluctuations can provide important references for trading other coins.
Seize the golden moments in trading.
Every day from 12 AM to 1 AM is a special trading period in the cryptocurrency market, where the 'money-making light' phenomenon tends to occur. This is the trading volume period for most of the world, and various unexpected situations may happen. Friends who want to buy at low prices or sell at high prices can place an ultra-low buy order or set an ideal price to earn passively before going to sleep, and they might just be lucky enough to complete the transaction.
Pay attention to USDT price trends.
Generally, USDT and Bitcoin move in opposite directions. When USDT rapidly rises, one should be alert for a sharp drop in Bitcoin; conversely, when Bitcoin rises, it is often a golden buying point for USDT. By grasping the price trend relationship between the two, one can make better trading decisions.
Pay attention to economic news from various countries' central banks.
The volatility in the cryptocurrency market is heavily influenced by governments' attitudes towards Bitcoin. If the government takes measures to suppress or control, the market will likely decline. Additionally, changes in US financial policies, such as the recent discussion about taxing the wealthy, will also have a significant impact on the cryptocurrency market. Therefore, paying attention to economic news from various countries' central banks every day is an essential task for cryptocurrency traders.
Grasp the key time periods.
Every day from 6 AM to 8 AM is a key period for determining buying and selling, and it can also be used to judge the day's rising or falling trends. If the price has been falling from 12 AM to 6 AM and continues to drop during this period, then it is a good time to buy or add positions; there is a high probability it will rise that day. Conversely, if the price has been rising from 12 AM to 6 AM and continues to rise, it is time to sell; there is a high probability it will drop that day.
Pay attention to 'Black Friday'.
There is a saying in the cryptocurrency market about 'Black Friday', where significant price drops occur more frequently on Fridays, but there can also be times of sideways movement or significant surges. Although this is not particularly accurate, it is still necessary to pay a little attention to the news.
Pay attention to trading volume.
Trading volume is the lifeline of digital currency. For cryptocurrencies with a certain level of trading assurance, if the price drops, there is no need to worry too much; patiently holding will likely bring back profits. It could be as short as a week or as long as a month. If you have extra funds, you can add to your position in batches to lower the average cost, which will speed up the return; if you don't have extra funds, then patiently wait, as it often won't disappoint.
Avoid frequent trading.
For the same cryptocurrency, holding on for the long term usually yields much greater returns than frequent trading, which tests the patience of investors. Frequent trading may not only increase transaction costs but also lead to erroneous decisions due to emotional fluctuations.
The application of K-line moving averages.
In cryptocurrency trading, the K-line theory has a certain applicability, but not all indicator analyses are useful. Although the accuracy of K-line technology is not one hundred percent, many people feel it is not very useful after learning it. In reality, based on the experience of many experts, K-line technology plays a crucial role in analyzing long-term trends in cryptocurrency prices. No matter which direction the price goes, it will be reflected in trading, and we can use these techniques to understand the price movements.
Moving average rules: Building trend frameworks.
In the one-hour trend cycle, we can use three EMA moving averages to build the trend framework: the fast line 21 represents short-term momentum, the middle line 55 reflects mid-term direction, and the slow line 144 defines the long-term trend. When the moving averages show 'fast line > middle line > slow line' in a bullish arrangement, the market is in a strong upward cycle; conversely, it is dominated by bears. This arrangement can effectively filter out noise; even if the moving average shows a turn, as long as the order of arrangement remains unchanged, the trend direction remains valid.
However, the moving average has a drawback of lagging. We can compensate for this by using the 'trend K-line confirmation' mechanism: when the price breaks through the moving average arrangement, wait for the 15-minute chart to show the same direction K-line (such as a large bullish line in an upward trend) before entering. This way, we can avoid false breakouts and capture trend acceleration stages. The choice of parameters also has its logic, with the 21-period corresponding to monthly level fluctuations, the 55-period fitting quarterly trends, and the 144-period resonating with the annual line. This combination has shown a stable win rate of over 65% in historical backtesting of forex, futures, and other varieties, with a profit-loss ratio of 1:2.3.
The support and pressure effect of moving averages.
Important parameters of moving averages have support and pressure effects. When the market tests important parameter moving averages from below to above, the market will face resistance, with expectations of a pullback or reversal downwards; when the market tests important parameter moving averages from above to below, the market will gain support, with expectations of a pullback or reversal upwards. In practice, we can select these important parameter moving averages and combine them with some reversal structures or patterns for trading.
For example, in the ETH/USDT one-hour chart in May 2024, the EMA 21/55/144 shows a bullish arrangement, but the price continuously retraces to the 55 moving average without breaking through. At this time, observing the 15-minute chart, one finds that each retracement is accompanied by shrinking trading volume and a doji star pattern, which is a typical 'trend continuation signal'. Ultimately, ETH broke through the previous high, with a single wave increase of 37%.
Moving average crossovers to determine trends and entry timing.
The crossing of moving averages is also a commonly used analysis method. Adding two moving averages to the chart, the one with smaller parameters is the fast line, which changes quickly; the one with larger parameters is the slow line, which changes slowly. There are two main uses for moving average crossings: first, to determine direction, where the slow line crossing above the fast line is a confirmation of a bullish trend; the slow line crossing below the fast line is a confirmation of a bearish trend. Second, to determine entry signals, where the slow line crossing above the fast line is a signal to enter a long position; the slow line crossing below the fast line is a signal to enter a short position.
For example, in a one-hour K-line chart of a particular spot gold, when the K-line falls below the moving average, it indicates a bearish trend. Wait for the K-line to retrace to the moving average to gain resistance without breaking, and once it breaks below the previous low, one can enter short, with the stop-loss set at the high point of the retracement. After the first order is placed, if the market drops again and retraces to the moving average, gaining resistance, after breaking the low again, one can enter to increase the position.
Combining moving averages with other indicators.
Moving averages can be combined with Fibonacci retracement, MACD, and other indicators to improve the accuracy of trading decisions. For instance, after confirming the direction with a moving average golden cross or death cross, the market has usually moved a certain distance. At this point, entering may not yield a reasonable profit-loss ratio. By combining with Fibonacci retracement, one can find key positions for trend retracements to enter, with smaller stop-loss spaces and more reasonable profit-loss ratios.
For example, when the market tests the moving average with a reversal expectation, if the MACD also shows a divergence pattern, it forms a resonance for market reversal, allowing entry with smaller moving averages. This way, the stop-loss space is small, and if the market moves out, the profit-loss ratio would be more ideal.
Trading is a long-term practice. To achieve gains in the cryptocurrency market, one must abide by the rules and build their own trading system. I hope this cryptocurrency trading strategy can provide beneficial references for your trading in the cryptocurrency market, and I wish everyone can achieve ideal profits.
The key point is coming! Next, I will share the application of K-line moving averages. We all know the importance of K-line in the stock market.
In the cryptocurrency market, these K-line theories only apply to a part and not all indicator analyses are applicable.
Although the accuracy of K-line technology is not one hundred percent, many K-line knowledge pieces, once learned, seem not very useful.
In fact, based on the experience of many experts, K-line technology still plays a key role in the long-term analysis of cryptocurrency prices.
Regardless of which direction the price will go, it will be reflected in trading, and we can use these techniques to understand.
The direction of the price movement, K-line indicates a high probability, guiding you to a bright path when you are confused.
Without further ado, let's get to the point.
Today, the focus is on basic indicator strategies.
1. Moving average usage and settings.
2. RSI indicator + method 3 value investment.
1. How to use moving averages to judge trends.
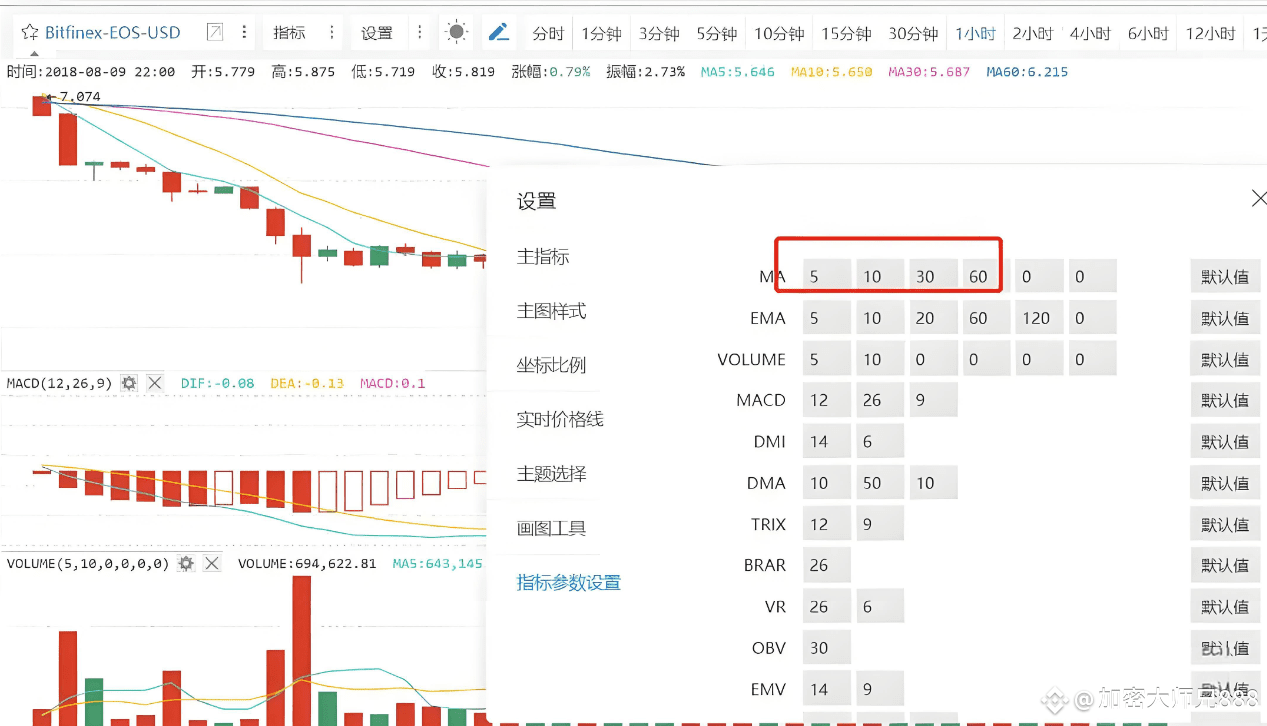
1. First, let’s learn how to set indicators.
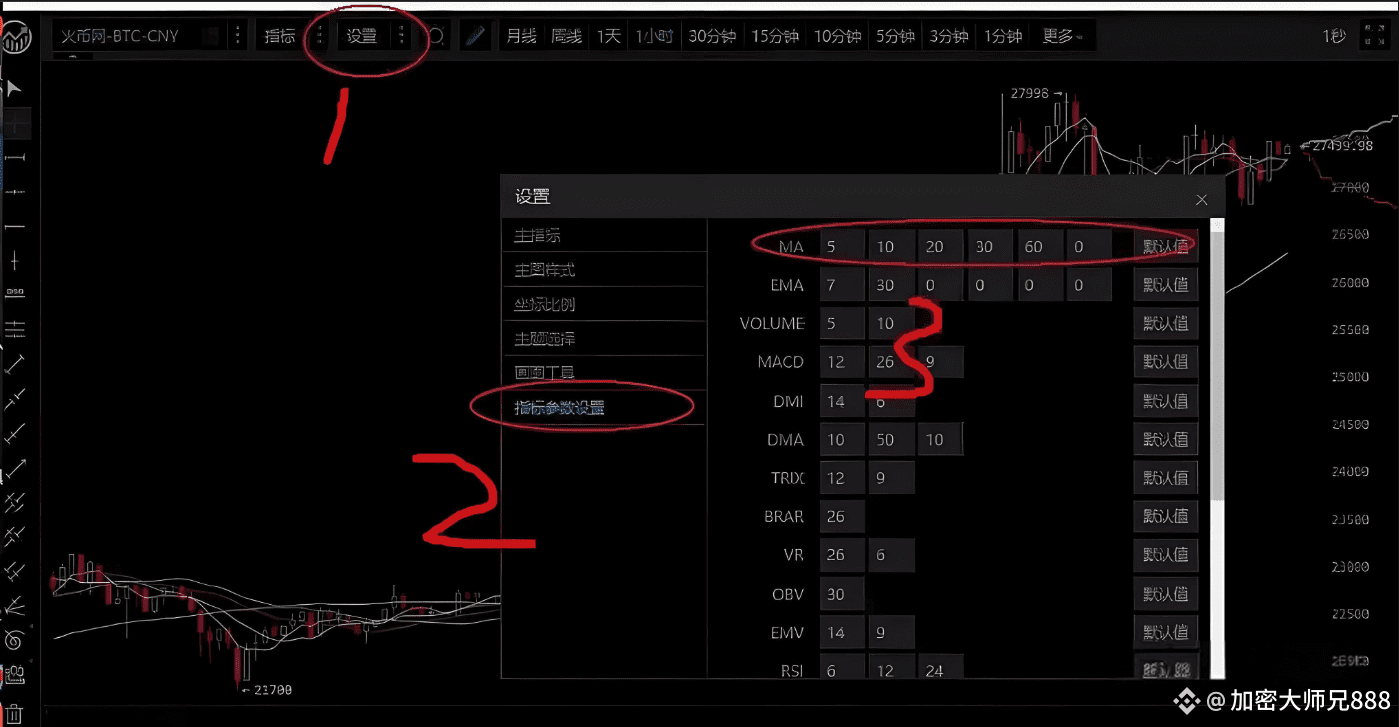
Due to updates on the Huobi exchange, if friends cannot find it, please directly click the line with the mouse.
You can see these lines and directly click on them to change.
After clicking, you can directly modify it here. The moving averages we will use are: 5-day line, 30-day moving average, 60-day moving average, 120-day moving average, as.
If you feel it is not useful, you can even change the five-day line to a four-day line for a more agile market response.
2. Short-term moving average indicators: 5-day line strategy.
The five-day line is commonly used for short-term trading. What is the five-day line? The five-day line is the sum of the closing prices over five days divided by five. Generally, the system is set up to be.
Weekly lines, in simple terms, use the average price over a week as the moving average, but a week is too long, and the reflection is relatively slow; of course, there are also.
The four-day line used by experts, etc., can all be visually displayed through settings. The five-day line is the most practical for short-term judgments.
The five-day line represents the average holding price for everyone over five days, indicating the buying and selling signals within those five days, reflecting what everyone can bear.
The average holding cost. Therefore, changing the moving average is the same principle.
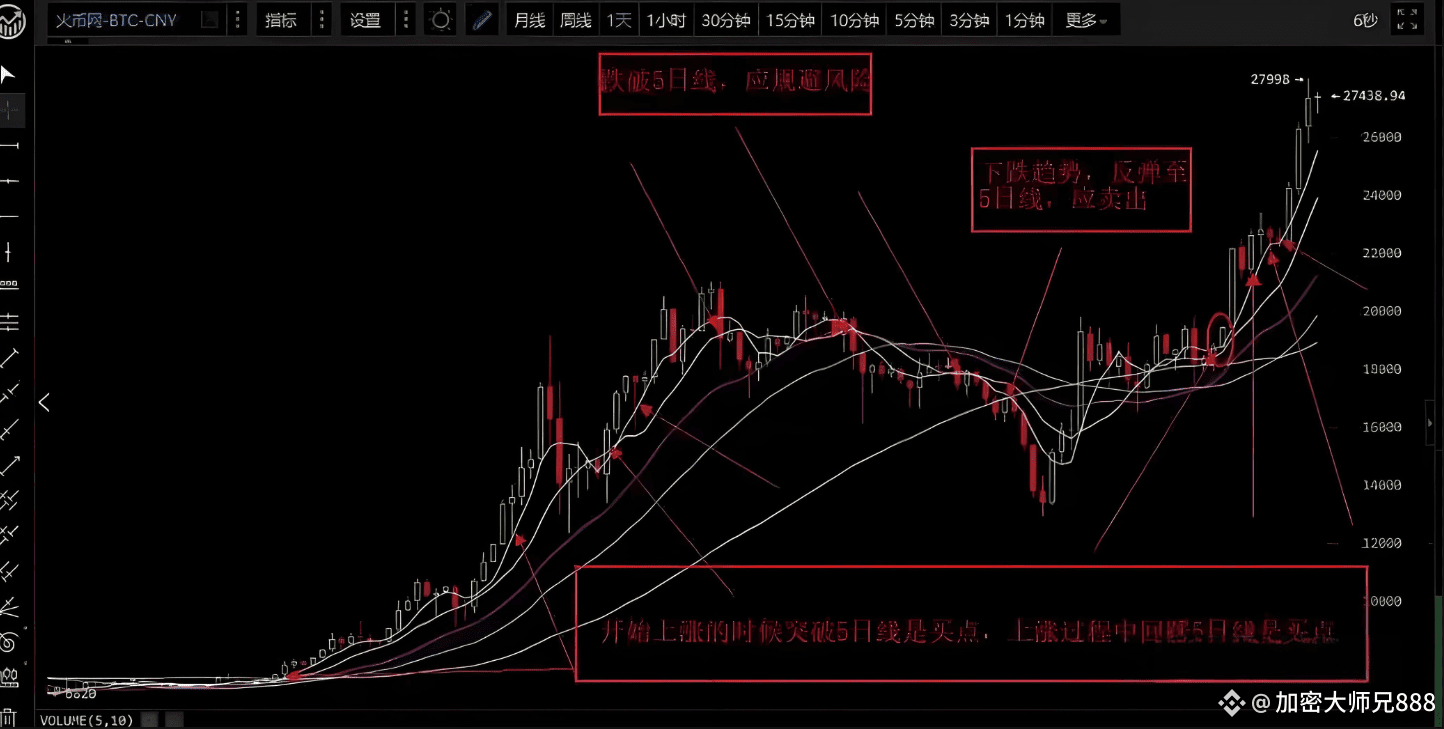
Usage: During a bull market, when the price retraces to the five-day line, it is time to increase the position (if it quickly breaks through, one should observe); in a bear market.
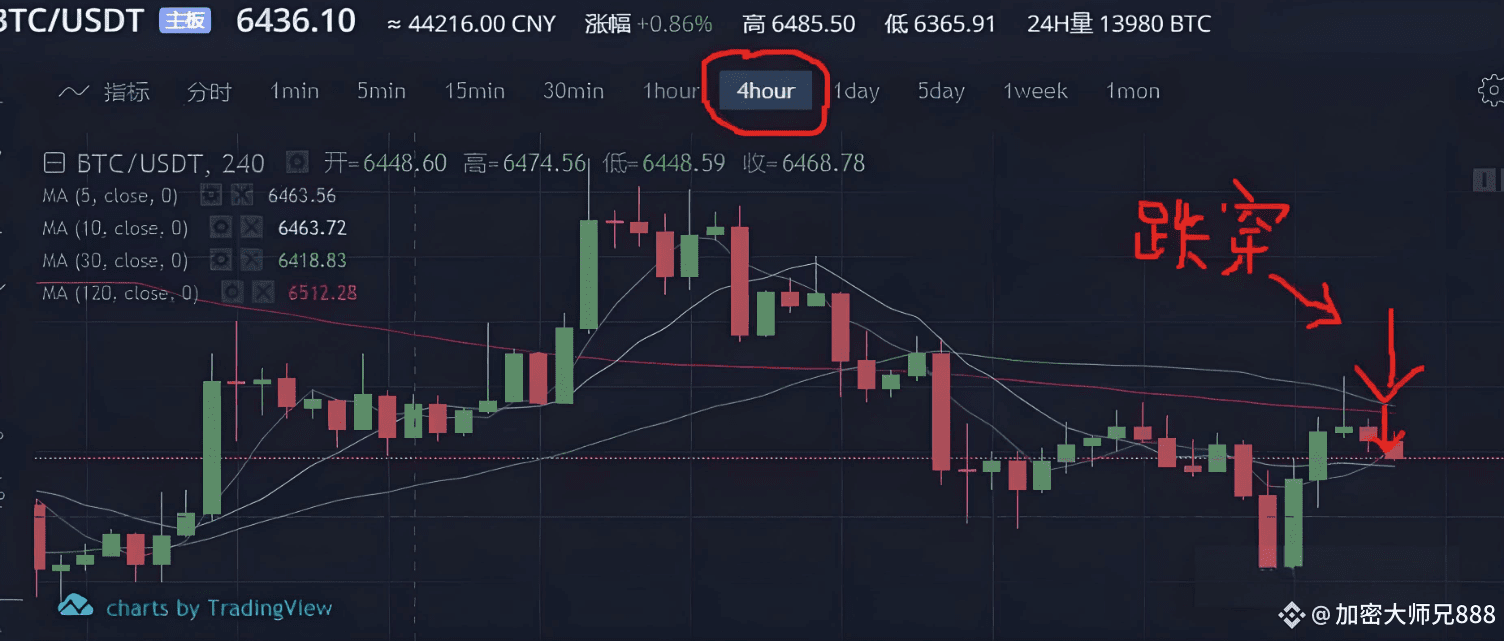
When the price falls below the five-day line, it is essential to sell quickly; as long as it does not break below the five-day line, there should not be significant issues. During periods of volatility, one can look at the 1-hour line.
And the 4-hour line, which is used for short-term trading.
This theory requires more exploration, as very few people will tell you that you will encounter many problems in practice, which requires you to explore more.
Validation shows that the five-day line strategy is very useful in practice and is one of the indicators that short-term experts must rely on.
Why use the five-day line? Because there is a saying that one day in the cryptocurrency market is equivalent to one year in the real world; the market reacts particularly quickly. If a conventional seven-day line is used, it will.
relatively slow and cannot keep up with market changes. We all know that there are no limits to the fluctuations in cryptocurrency, even 24 hours a day.
In trading.
If using the five-day line as a judgment standard, when the price reaches the five-day line, it will form a support level. If it sells, it will break below the five-day line.
Once you have to wait to return to the cost price, you can only wait, and this point forms a support level.
It shows that the current price has not yet stood above the five-day line, and there are still many uncertainties. At this time, it is when we should use the one-hour and four-hour lines.
Practical summary: This strategy mainly uses short-term indicators. When approaching the moving average, which is also the cost price for everyone, selling pressure will decrease, making it relatively.
The price will rise again, and if it deviates too much from the moving average, the probability of adjustment will increase, mainly because investors will choose to arbitrage, leading to.
Price drop.
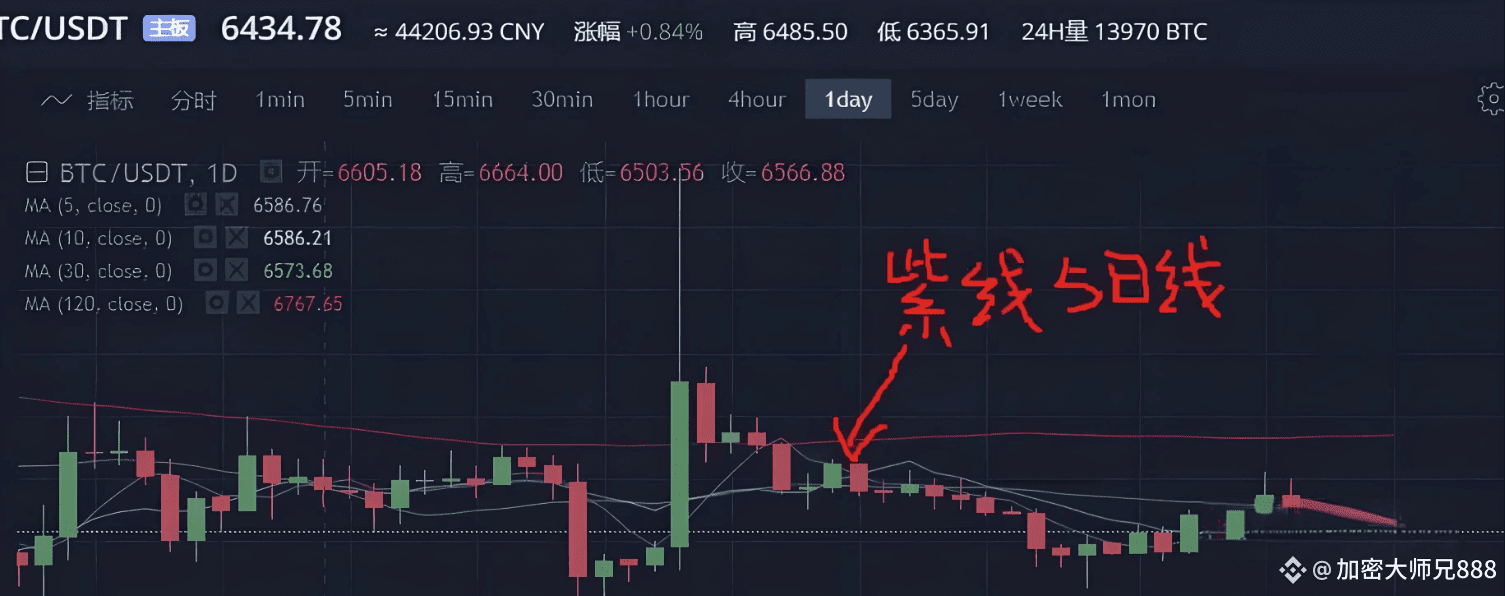
3. Use of the 30-day line in conjunction with the 10-day line for short-term strategies.
The 30-day line is also a short to medium-term strategy; if you are not very fond of trading, we recommend this strategy to you.
As per the previous setup: 5-day line, 30-day line, 60-day line, 120-day line, change the 60-day line to a 10-day line.
line. Because this set of indicators only uses the 10-day and 30-day lines.
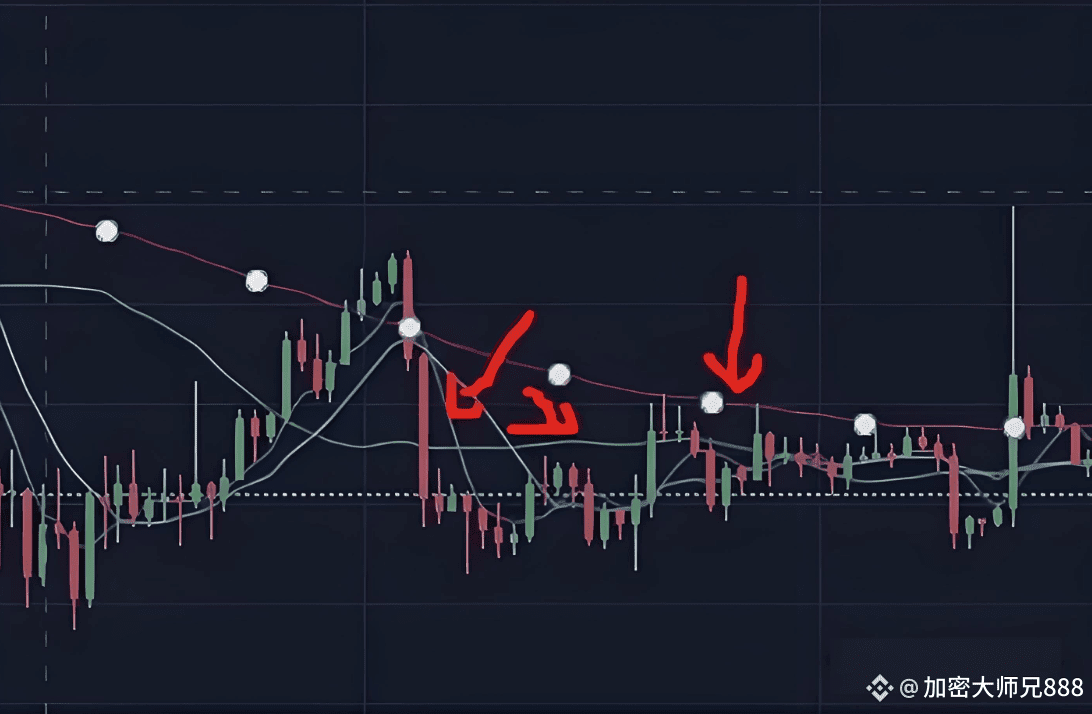
This set of indicators is relatively simple to use: sell when it breaks below the 10-day line, buy when it breaks above the 30-day line. The time frame is changed to one hour, as detailed in the diagram:
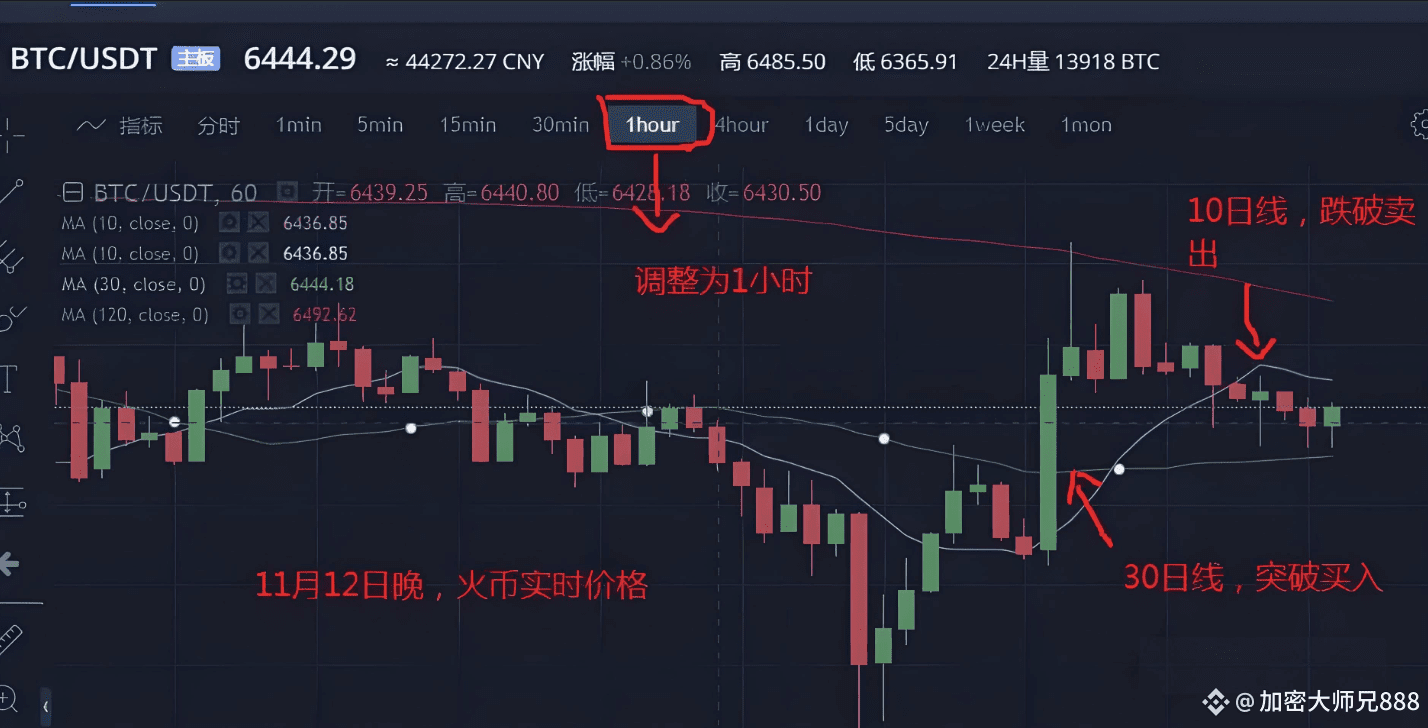
This theory is similar to the five-day line; the 30-day line is for short to medium-term trends, set to one hour, turning it into a short-term buying point, while falling.
Breaking the 10-day line opens a short-term downward channel. Through such combinations and practical applications, it is highly effective.
4. Medium to long-term strategy: 60-day line and 120-day line.
This chart shows the trend of EOS. It is said that some investors trade the 60-day line a few times a year to make stable investments. This method is suitable for those investors who do not have time to trade.
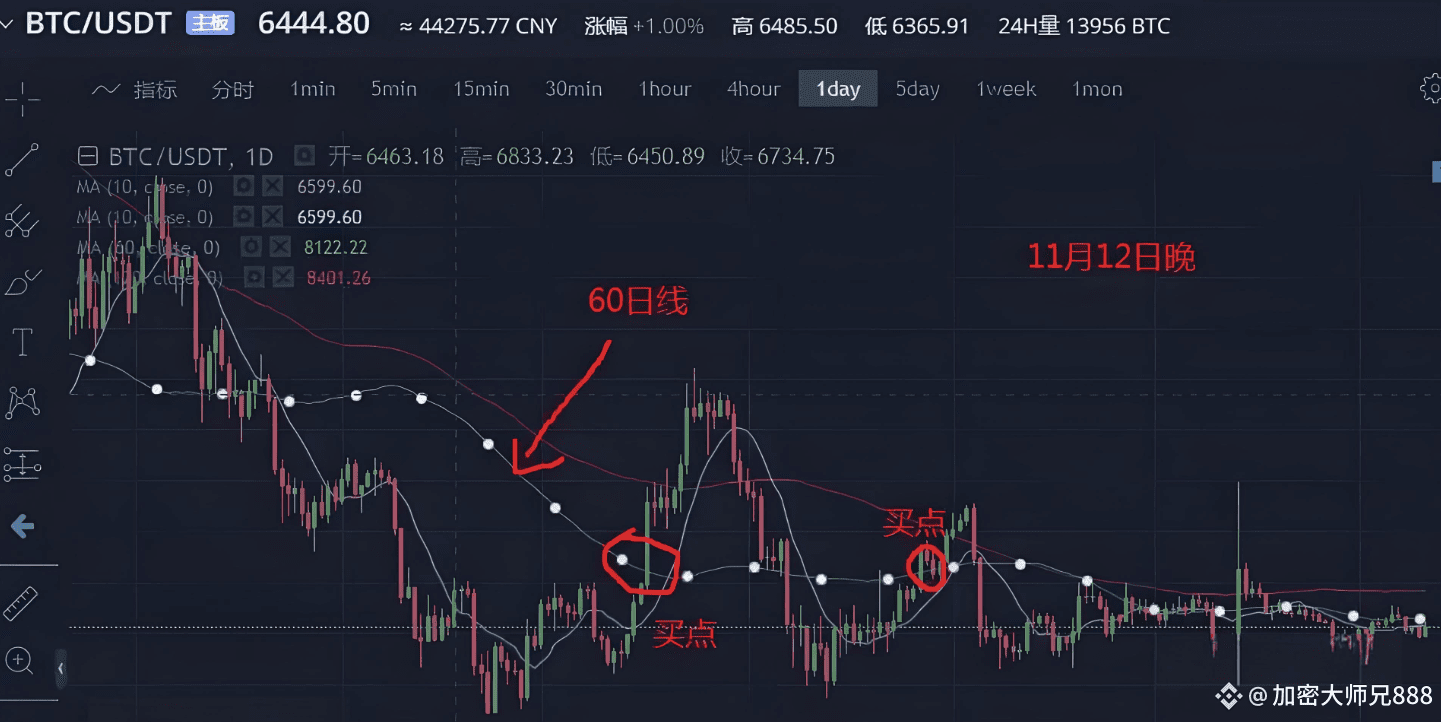
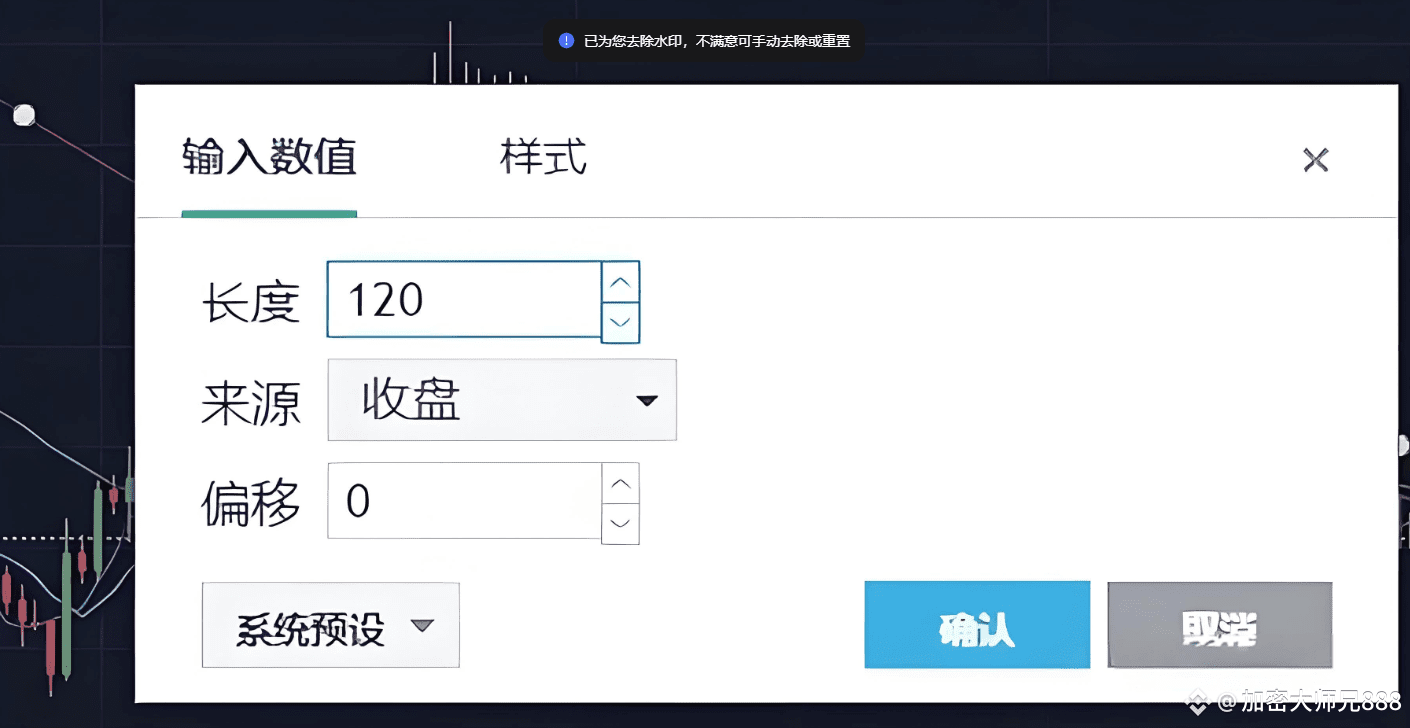
Speaking of the 120-day line, it is the dividing line between bulls and bears.
So how to use the 120-day line for investment?
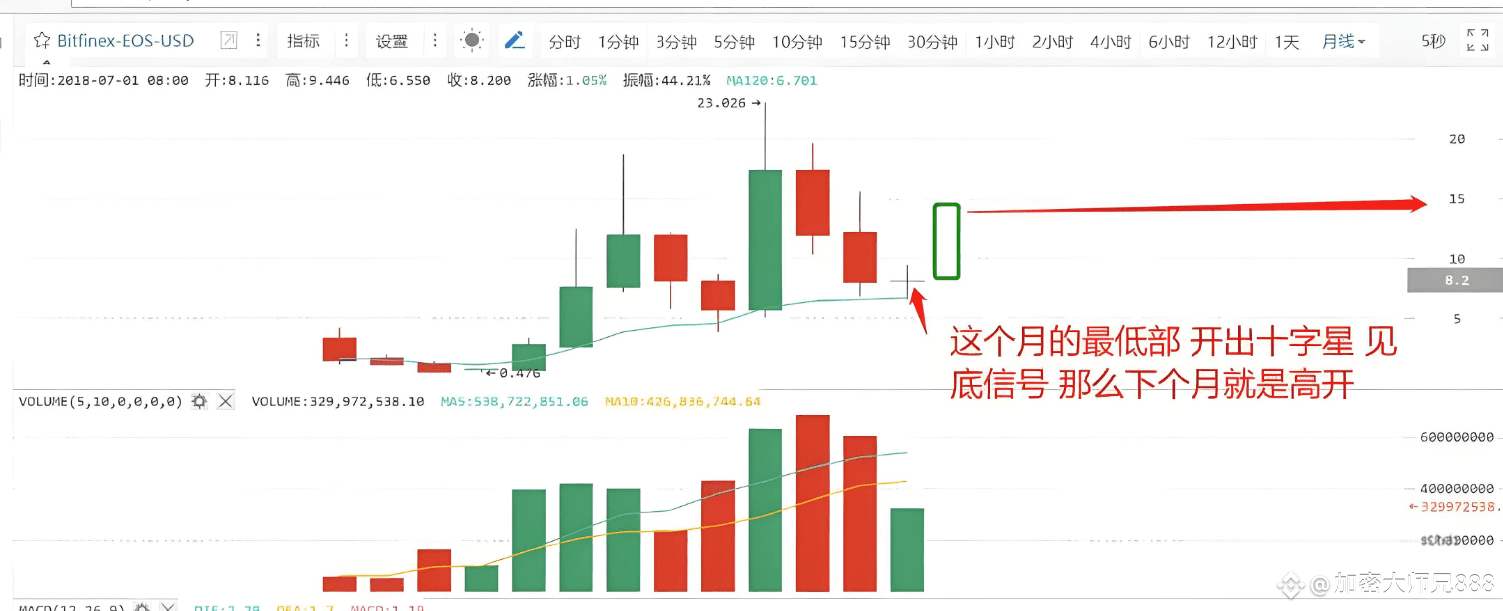
This was the previous technical chart, and according to the current market conditions, it has not broken through the 120-day line. The use of the 120-day line is actually to judge the arrival of a long-term bull market.
Technical indicators of trends are also a reference basis in daily trading. This bear market has not yet ended, and once it crosses the 120-day line.
The daily line is an indicator for judging the arrival of a bull market.
We often see that the so-called resistance and support levels mentioned by various experts are essentially the moving averages. When analyzing major trends, long-term investors should be cautious.
In that case, do not rely on the five-day line strategy; the reference moving average for bull-bear transitions is primarily the 120-day moving average.
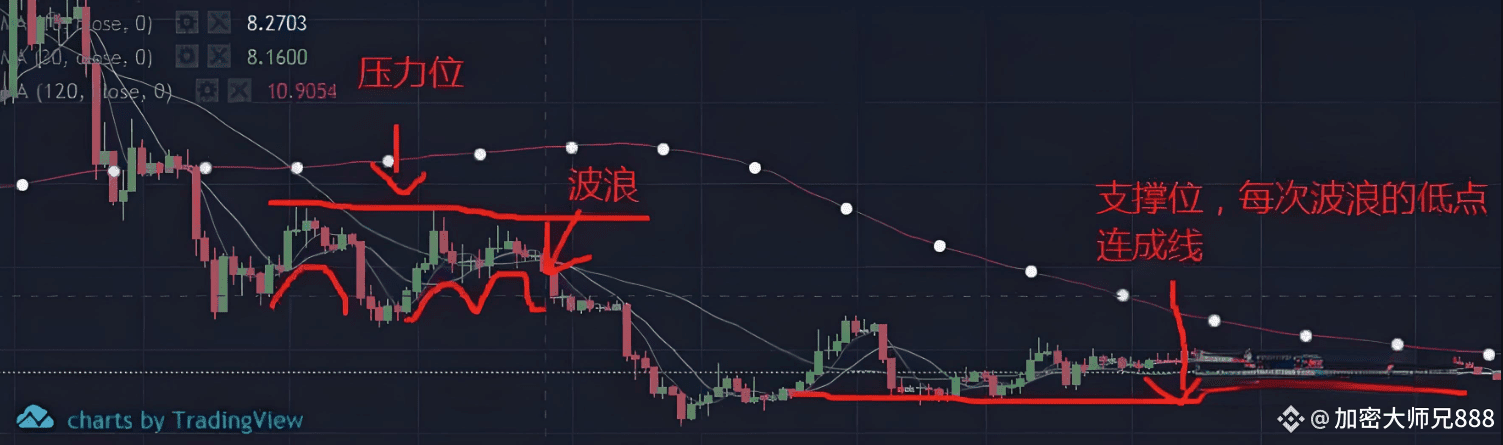
5. Box wave to observe pressure and support.
This is from Elliott Wave Theory*, which provides a good explanation of wave trading strategies. Many novices in the stock market have relied on this theory.
Having swept through the stock market for many years, of course, whether it is practical or not remains to be seen, as seeing is believing. Here we will briefly introduce box wave support and resistance.
Resistance level.
When the price of a cryptocurrency operates within a certain box, the formed waves' highest points align on one line, indicating a resistance level, while the bottom of the waves indicates a support level.
A connected line forms a support level. The general judgment is that breaking through may lead to a higher rush; in this case, how should one choose?
How to choose? The main point comes from the fundamentals, which is to release good news or have large funds entering the market, allowing one to ride the wave.
In another scenario, after breaking through, it may also enter a consolidation phase, which is also quite common, indicating that funds are too weak to push higher or that selling pressure is too great. At this point, one should.
Of course, such a span would be relatively large and can only serve as a reference.
By analyzing the low and high points through box waves, judging support and resistance is also a common analytical method, mindlessly simple.
However, they are not so accurate; everyone can explore this in daily practice or refer to books on wave theory. Of course, it is also said to be practical.
In terms of theory, I have read several good books on waves. In real-world practice, their effectiveness is not very good, but this does not mean that everyone will not see results after reading.
Everything still relies on practical exploration. I prefer practical techniques rather than conceptual things. What do you think?
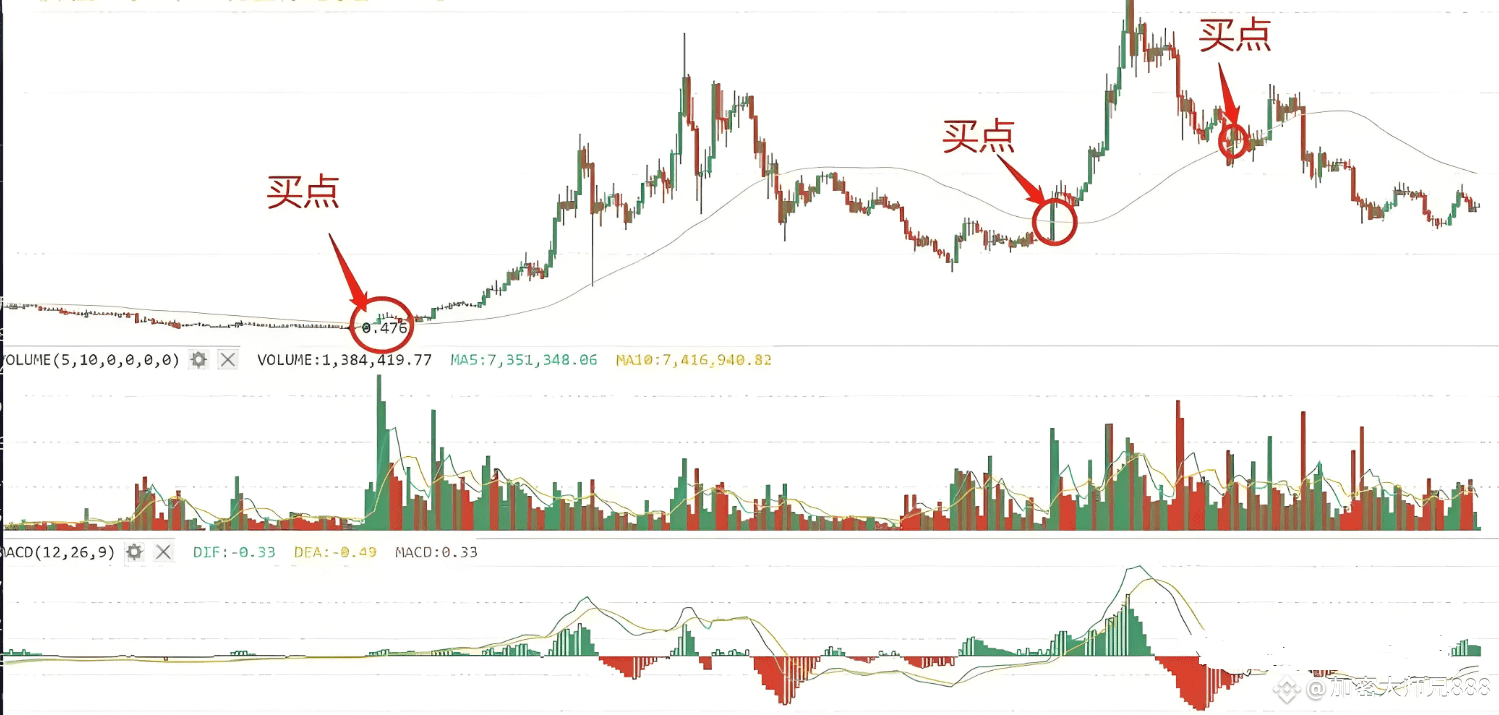
6. RSI bottom-fishing and top-exiting rules.
RSI is also an old technical indicator in the stock market, and it works particularly well as a reference in the cryptocurrency market.
The RSI indicator represents a measure of strength, calculated by statistically obtaining values for the rise and fall of cryptocurrency prices.
The principle of the RSI indicator, simply put, is to calculate the comparison of buying and selling forces numerically. For example, if there are one hundred people buying.
If one cryptocurrency has sixty buyers and forty sellers, the price will rise.
So how should it be used? 80 to 100 is extremely strong sell; 20 to 50 is extremely strong buy; weak watch at 0 to 20, which is extremely weak buy.
Once it reaches a golden cross, it becomes a buy or sell point.
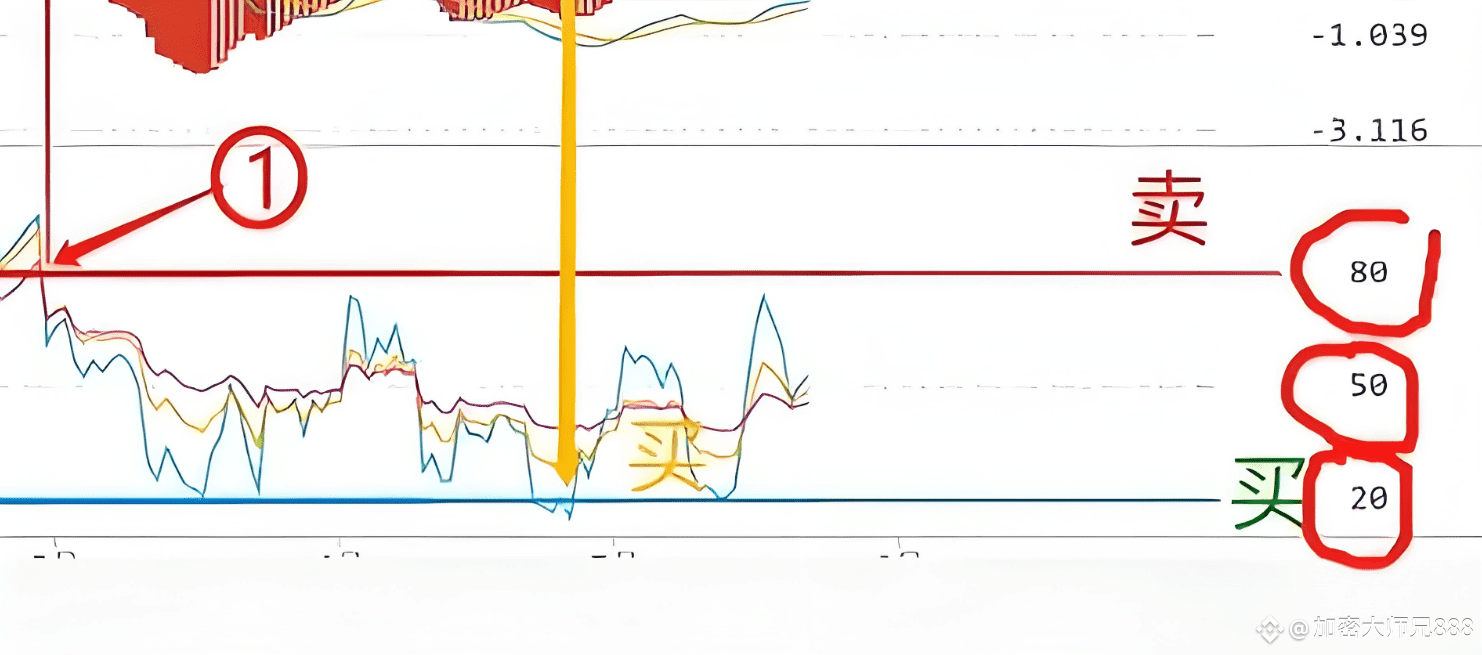
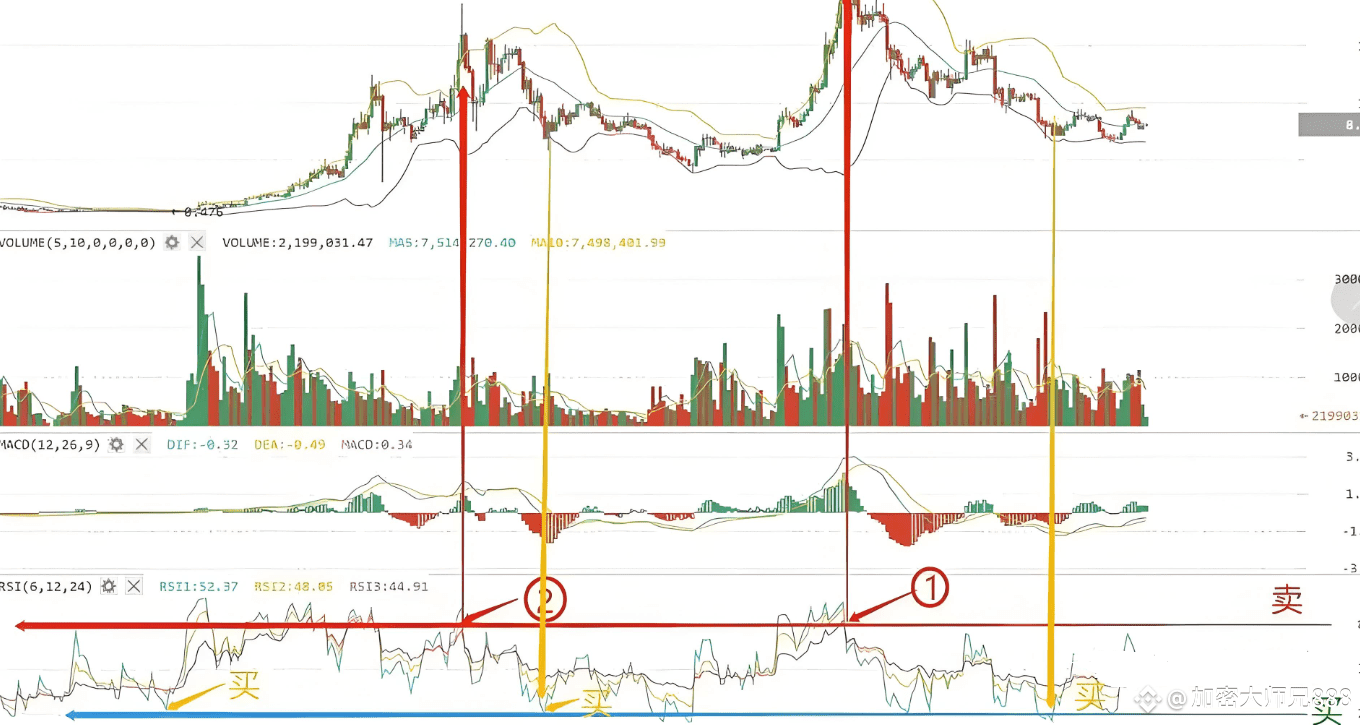
Be aware that if it reaches 80, there is a significant risk of a pullback. So when should one sell? Sell at the moment it breaks below 80; the RSI technique is
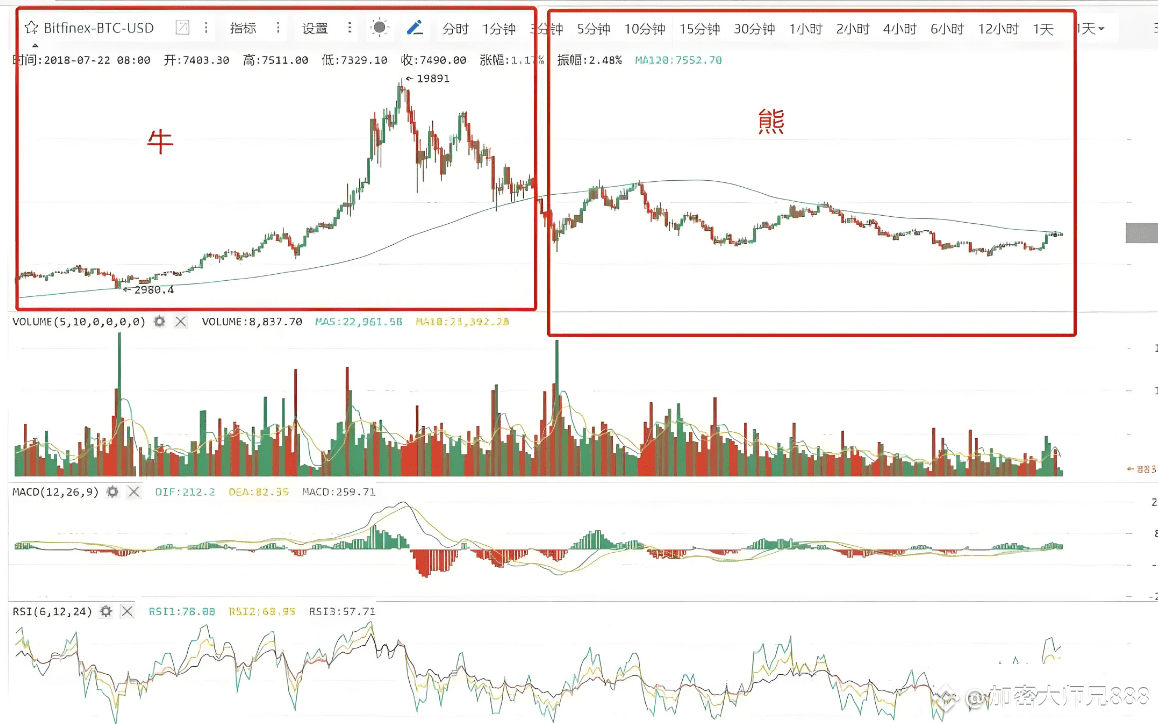
Proven by the market, it has been in use since 1978 and demonstrates significant reference value, while in emerging cryptocurrencies.
In the cryptocurrency market, this set of indicators can also effectively lead you to victory.
Short-term waves can choose a one-hour line for operations, achieving peak escape in waves.
Summary: Let’s review what we discussed today regarding five technical indicators, the 5-day line strategy, the combination of the 10-day line and the 30-day line, and more.
The functions of the long-term strategy of the 60-day line and the 120-day line, box wave support and resistance levels, and RSI bottom-fishing and top-exiting rules. The above reference indicators, although.
Many are very simple, but in reality, the simpler the reference indicator, the easier it is to use. In practice, we have introduced five technical indicators for you.
Cryptocurrency trading methods through practical investment; I believe there is always something that can bring you a different investment experience, and there is always something that can become a tool on your investment journey.
You no longer need to stay up late to watch the market and guess the trend, nor do you need to struggle with whether the buy and sell points are accurate. Only take opportunities with clear trends; hold back during bear markets and hold positions during bull markets. In the next wave of the market, I will say that we will eat meat together at the right rhythm, allowing profits to beat 90% of retail investors! Remember, the cryptocurrency market does not lack opportunities; what it lacks is the execution ability to keep up.