Understanding Japanese Candlesticks: A Key to Unlocking Market Trends
Japanese candlesticks are a popular charting tool used in technical analysis to visualize price movements in financial markets. They provide valuable insights into market sentiment, helping traders and investors make informed decisions.
What are Japanese Candlesticks?
A Japanese candlestick chart consists of individual candlesticks, each representing a specific time period (e.g., minute, hour, day). Each candlestick has four main components:
1. Body: The main part of the candlestick, representing the price range between the opening and closing prices.
2. Wick: The thin lines above and below the body, indicating the high and low prices.
3. Open: The opening price of the period.
4. Close: The closing price of the period.
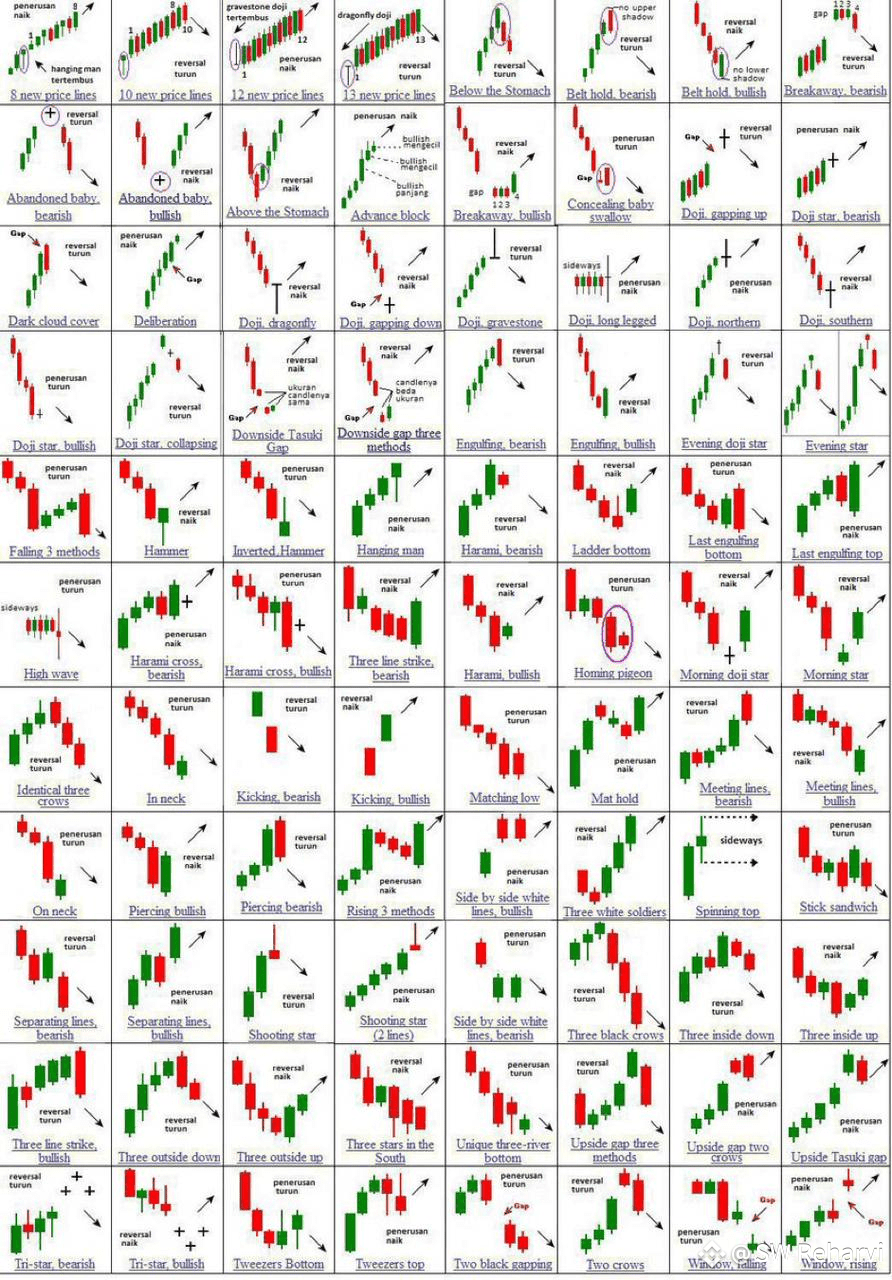
Types of Japanese Candlesticks
There are various types of Japanese candlesticks, each with its own unique characteristics and market implications. Some common types include:
➡️Bullish Candlesticks: Indicate upward price movement, often signaling buying opportunities.
➡️Bearish Candlesticks: Indicate downward price movement, often signaling selling opportunities.
➡️Doji Candlesticks: Indicate market indecision, often signaling a potential trend reversal.
Using Japanese Candlesticks in Trading
Japanese candlesticks can be used in various ways to inform trading decisions. Some common strategies include:
➡️Identifying Trends: Using candlestick patterns to identify market trends and potential reversals.
➡️Spotting Reversals: Using candlestick patterns to identify potential trend reversals.
➡️Confirming Trades: Using candlestick patterns to confirm trading decisions.
Conclusion
Japanese candlesticks are a powerful tool for traders and investors, providing valuable insights into market sentiment and trends. By understanding the different types of candlesticks and their implications, market participants can make more informed decisions and improve their trading performance.