Whether you're trading crypto, stocks, or forex, your success hinges on timing, analysis, and discipline. One of the most effective tools for gaining an edge in the market is recognizing chart patterns.
The chart you’ve referenced showcases 16 essential patterns, grouped into Bullish, Bearish, and Reversal categories. Learning how to identify and trade these patterns can greatly enhance your profit potential — while helpi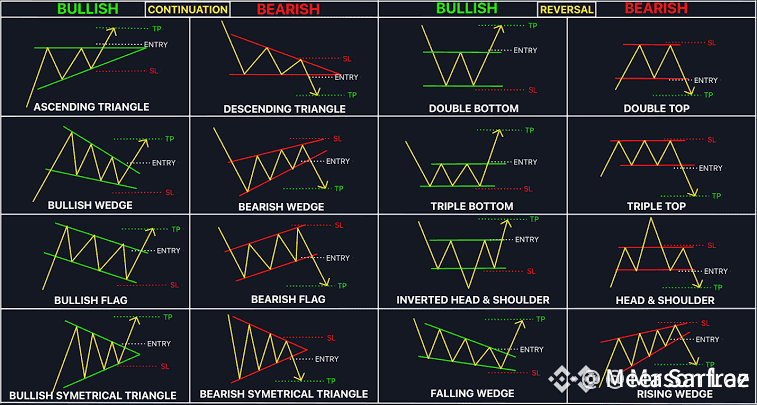 ng you cut losses early.
🔍 What Are Chart Patterns?
Chart patterns are visual formations created by price movements over time. They reflect collective market psychology and behavior, helping traders anticipate future price direction based on historical trends.
🚀 Bullish Patterns – Look for Breakouts
Bullish patterns suggest a likely upward move. Once confirmed, traders typically enter long (buy) positions.
Examples:
Ascending Triangle
Bullish Wedge
Bullish Flag
Bullish Symmetrical Triangle
Double Bottom
Triple Bottom
Inverted Head & Shoulders
Falling Wedge
Trading Strategy:
Entry: After breakout above resistance
Stop-Loss (SL): Below recent swing low
Take-Profit (TP): Use prior highs or pattern projection
📉 Bearish Patterns – Get Ready to Short
Bearish patterns point to a potential downward trend. Look to enter short (sell) positions after confirmation.
Examples:
Descending Triangle
Bearish Wedge
Bearish Flag
Bearish Symmetrical Triangle
Double Top
Triple Top
Head & Shoulders
Rising Wedge
Trading Strategy:
Entry: After breakdown below support
Stop-Loss (SL): Above recent swing high
Take-Profit (TP): Previous lows or projected move
♻️ Reversal Patterns – Spot Trend Changes Early
Reversal patterns indicate a change in market direction — catching these can position you at the beginning of a new trend.
Examples:
Double Bottom → Bullish Reversal
Double Top → Bearish Reversal
Inverted Head & Shoulders → Bullish Reversal
Head & Shoulders → Bearish Reversal
📈 7 Key Tips to Maximize Profit Using Chart Patterns
Wait for Confirmation
Don’t jump the gun — confirm breakouts or breakdowns with price action and volume.
Pre-Set Entry, SL, and TP
Every pattern should have a clear plan:
✅ Entry (after confirmation)
❌ SL (red dotted line)
✅ TP (green dotted line)
Use Risk-Reward Ratio (RRR)
Aim for at least a 1:2 RRR — risking $10 for a potential $20 gain.
Combine with Volume & Indicators
Use tools like RSI, MACD, and moving averages to confirm your setups.
Backtest Before Trading Live
Test patterns on historical data or use demo accounts to refine your strategy.
Focus on Higher Timeframes
Patterns on 1H, 4H, or Daily charts are more reliable than those on 5M or 15M.
Avoid Overtrading
Only trade high-probability setups. Patience and quality win in the long run.
💡 Final Thoughts
Chart patterns are powerful tools when used with discipline and proper risk management. They can help you:
Enter trades earlier
Avoid poor setups
Lock in better profits
Reduce unnecessary losses
Top traders don’t chase every opportunity. They wait for clear patterns, follow a trading plan, and stick to proven strategies.
#TradingTips #ChartPatterns #CryptoTrading #BinanceSquareFamily #TechnicalAnalysis