The tight consolidation of Bitcoin just below USD 120,000 suggests that bulls are holding their positions while anticipating a spike in volatility.

Price predictions as of 30/7: BTC, ETH, XRP, BNB, SOL, DOGE, ADA, HYPE, XLM, SUI
PRICE ANALYSIS
Key points:
Bitcoin continues to be stuck in a narrow range, suggesting that a breakout could occur at any moment.
The FOMC minutes and the Federal Reserve's interest rate decision could set the tone for the next steps in cryptocurrencies.
Bitcoin
BTC
103,512 €
continues trading near the resistance of USD 120,000, indicating that the bulls have maintained pressure. Although Bitcoin is in a strong position, the rally could face seasonal difficulties. According to Axel Adler Jr., BTC has recorded an average return of only 2.56% in August over the last 13 years.
However, short-term uncertainty or historical weakness in August has not prevented Strategy from buying more BTC. The company announced on Tuesday that it had acquired 21,021 BTC at an average price of USD 117,256, bringing its total holdings to 628,791 BTC.
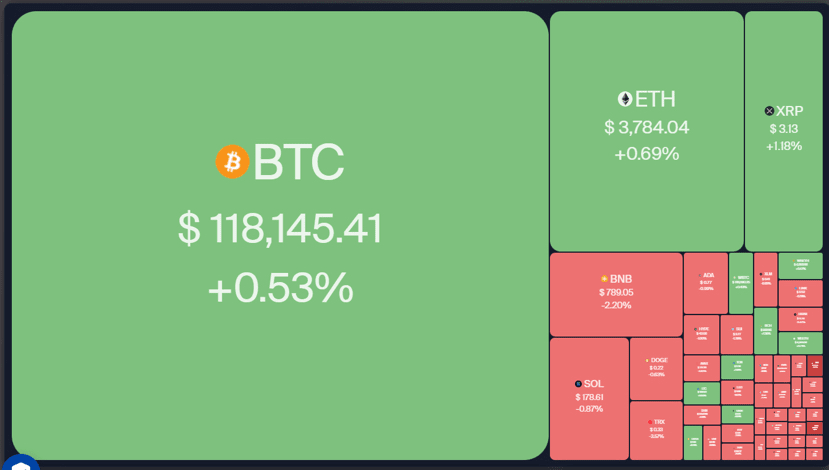
Daily view of cryptocurrency market data. Source: Coin360
As BTC consolidates, Ether
ETH
3373 €
and BNB
BNB
696.66 €
have been gaining ground. Glassnode said in a post on X that the dominance of ETH's perpetual futures volume has surpassed that of BTC, representing the "largest volume bias" ever recorded. "This shift confirms a significant rotation of speculative interest towards the altcoin sector," the analysis platform added.
Could BTC break out of its range? Will some select altcoins continue their bullish trend? Let's analyze the charts of the top 10 cryptocurrencies to find out.
Price prediction of #bitcoin
BTC continues to trade within a narrow range between USD 115,000 and USD 120,000. The longer the price remains within a narrow range, the greater the eventual breakout will be.
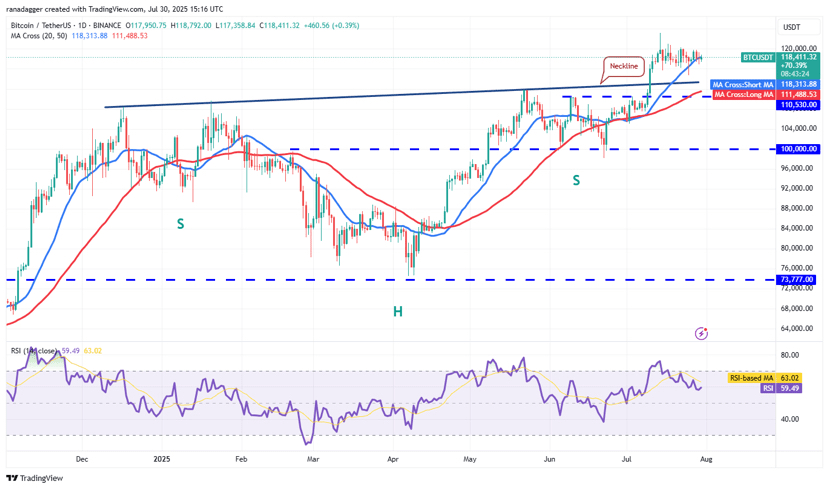
Daily chart of the BTC/USDT pair.
The upward 20-day simple moving average (SMA) (USD 118,313) and the relative strength index (RSI) in positive territory indicate that the path of least resistance is upward. If buyers push the price above USD 120,000, the BTC/USDT pair could gain momentum and reach a new all-time high above USD 123,218. The pair could then ascend to USD 135,000.
On the contrary, a breakout and a close below USD 115,000 would suggest that bears have overpowered bulls. That could sink the price down to USD 110,530. This is a vital support level to watch, as a break below it would open the doors to a drop to USD 100,000.
Ether price prediction
ETH is trying to stay above the breakout level of USD 3,745, indicating that the bulls are not rushing to take profits, as they anticipate another rise.
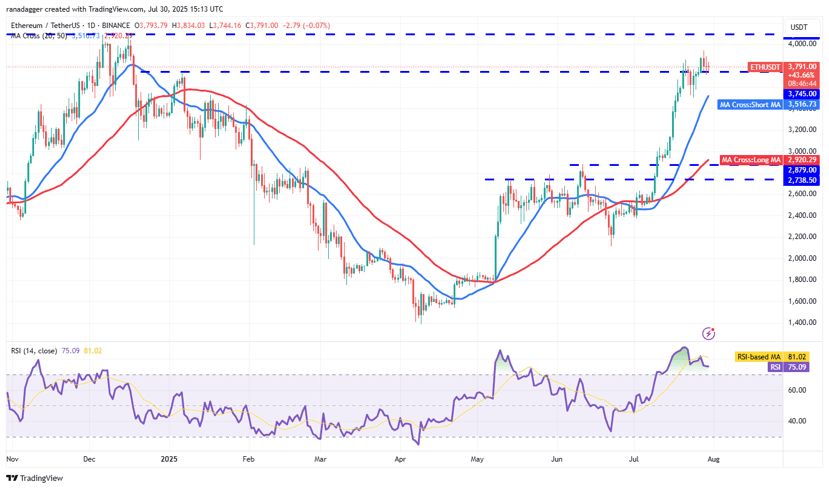
Daily chart of the ETH/USDT pair.
If the price rebounds from the support of USD 3,745, the ETH/USDT pair could reach upper resistance at USD 4,094. Sellers are expected to pose a strong challenge at USD 4,094, but if the bulls prevail, the pair could shoot up to USD 4,868.
On the contrary, if the price falls and breaks below USD 3,745, this would suggest that the bulls have given up. That could drag the price down to the 20-day simple moving average (SMA) (USD 3,516), where buyers are expected to intervene. If the price bounces strongly from the 20-day SMA, the bulls will again attempt to break the upper resistance.
XRP price prediction
The XRP
XRP
2.74 €
is witnessing a fierce battle between buyers and sellers at the 20-day simple moving average (SMA) (USD 3.16).
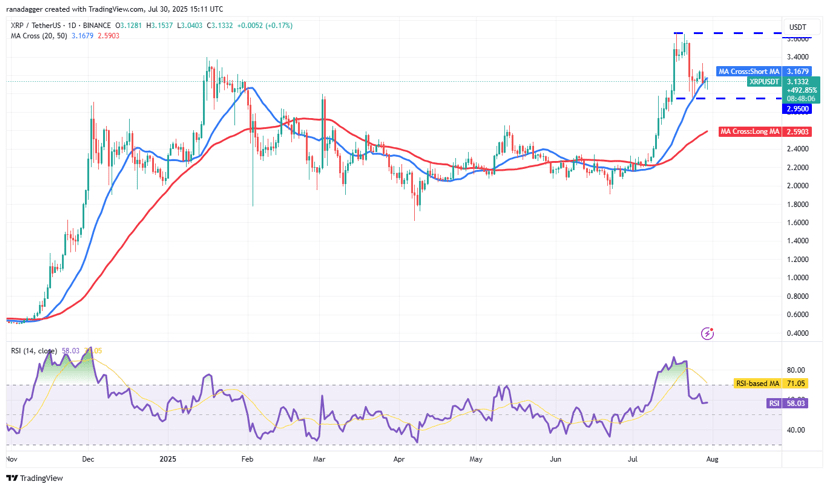
Daily chart of the XRP/USDT pair.
If the price falls below the support of USD 3.05, the next stop is likely USD 2.95. Buyers are expected to defend the level of USD 2.95 strongly, as a break below this could lead to a deeper correction towards USD 2.65.
On the other hand, a strong bounce from the level of USD 2.95 suggests solid demand at lower levels. The 20-day simple moving average (SMA) could act as resistance on the way up, but if the bulls overcome it, the XRP/USDT pair could rise to USD 3.33 and then to USD 3.66.
BNB price prediction
BNB has retraced to the breakout level of USD 794, which is a crucial support to watch.
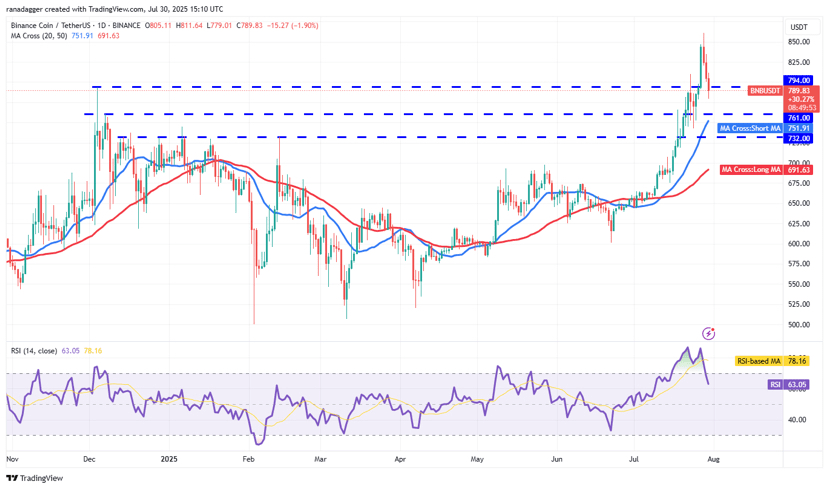
Daily chart of the BNB/USDT pair.
If the price rebounds strongly from USD 794, this suggests that the bulls are trying to turn that level into support. If that happens, the BNB/USDT pair could retest the all-time high of USD 861. A breakout and a close above USD 861 could start the next stage of the bullish trend towards USD 900.
On the contrary, a breakout and a close below the level of USD 794 would indicate that short-term buyers are taking profits. The pair could then fall to the 20-day simple moving average (SMA) (USD 751), which would likely attract buyers. Sellers will have to push the pair below the 20-day SMA to gain an advantage.
Solana price prediction
Solana (SOL) has retraced to the 20-day simple moving average (SMA) (USD 178), which will likely act as a solid support.
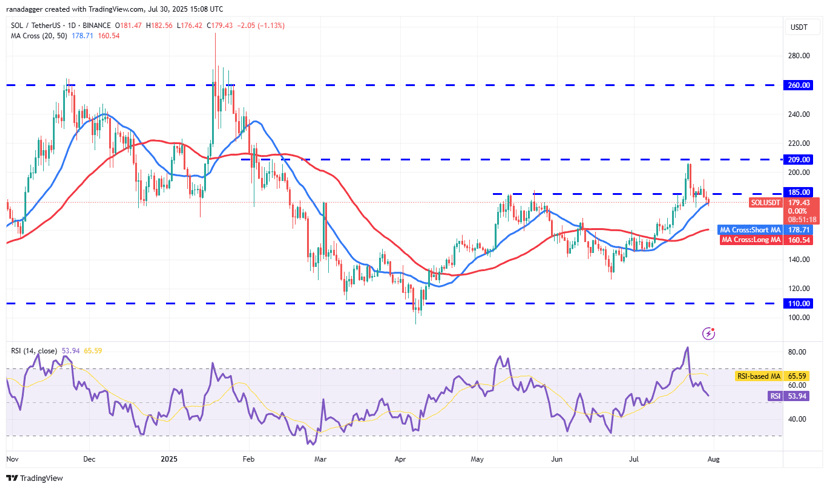
Daily chart of the SOL/USDT pair.
If the price bounces strongly from the 20-day simple moving average (SMA), the bulls will again try to push the SOL/USDT pair towards the upper resistance of USD 209. A breakout and a close above USD 209 could open the doors to a rally up to USD 240. There is minor resistance at USD 220, but it is likely to be overcome.
On the contrary, a breakout and a close below the 20-day simple moving average (SMA) could drag the price down to the 50-day simple moving average (SMA) (USD 160). This suggests that the pair could prolong its stay within the broad range between USD 110 and USD 209 for a few more days.
Dogecoin price prediction
Dogecoin (DOGE) dropped from USD 0.25 on Monday and broke below the 20-day simple moving average (SMA) (USD 0.22) on Tuesday, indicating selling on rallies.
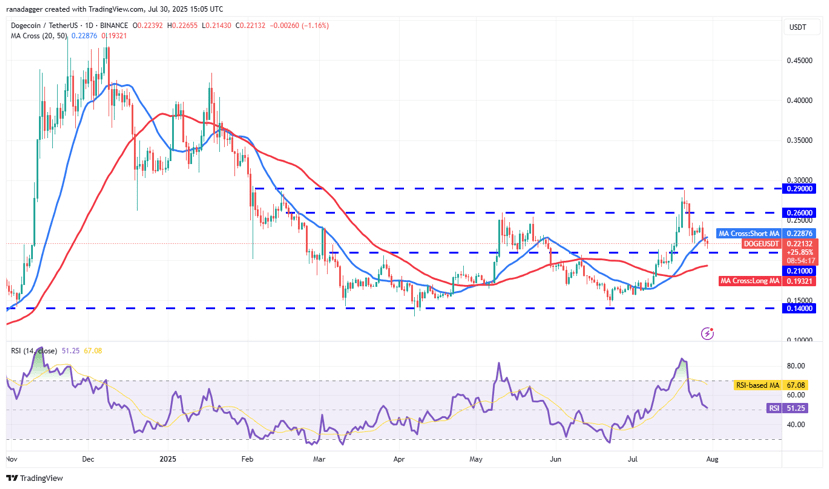
Daily chart of the DOGE/USDT pair.
The next support is at USD 0.21. If the price bounces at USD 0.21 and surpasses the 20-day simple moving average (SMA), the bulls will attempt to push the DOGE/USDT pair to USD 0.26 and then to USD 0.29. Sellers are expected to defend the level of USD 0.29 with all their strength, as a close above it could push the pair to USD 0.35 and then to USD 0.44.
On the other hand, a breakout and a close below USD 0.21 could sink the pair to the 50-day simple moving average (SMA) (USD 0.19). This suggests that the pair could remain within the broad range of USD 0.14 to USD 0.29 for a while longer.
Cardano price prediction
Cardano (ADA) fell below the 20-day simple moving average (SMA) (USD 0.79) on Tuesday, indicating that bears are trying to take control.
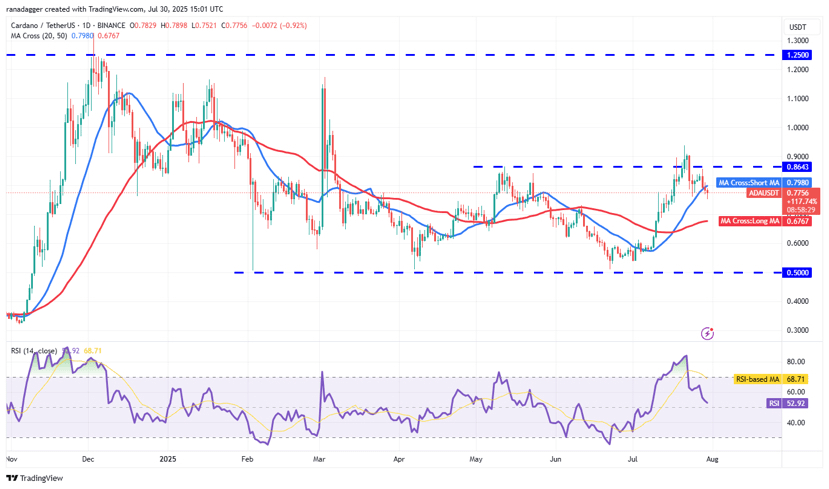
Daily chart of the ADA/USDT pair.
There is support at USD 0.76, but if that level is broken, the ADA/USDT pair could extend the correction to USD 0.73 and then to the 50-day simple moving average (SMA) (USD 0.67). Such a drop suggests that the pair could remain within the range of USD 0.50 to USD 0.86 for a while.
The first sign of strength will be a breakout and a close above the 20-day simple moving average (SMA). This suggests a lack of aggressive selling at lower levels. The bulls will then try to push the pair above the resistance of USD 0.86.
Hyperliquid price prediction
Hyperliquid (HYPE) has been stagnating between the support line of the ascending channel and the 20-day simple moving average (SMA) (USD 45.13).
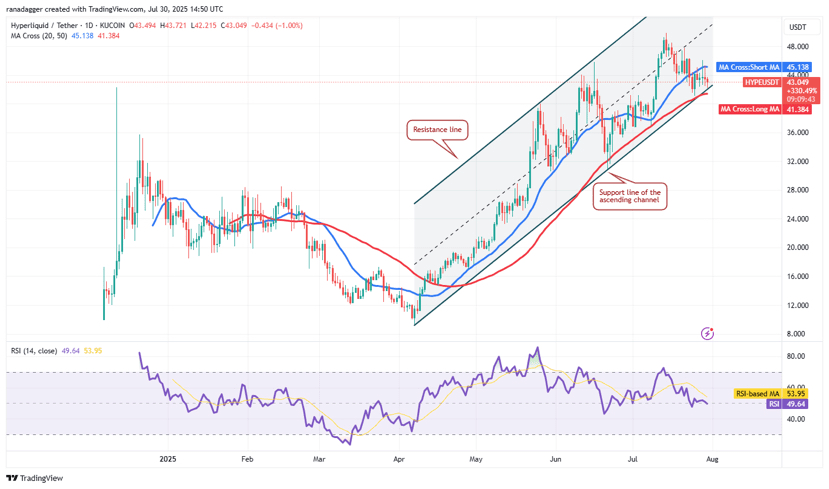
Daily chart of the HYPE/USDT pair.
The failure of bulls to push the price above the 20-day simple moving average (SMA) increases the risk of a break below the support line. If that happens, the HYPE/USDT pair could correct to USD 36 and then to USD 32.
This negative outlook will be invalidated in the short term if the price rebounds and rises above the 20-day simple moving average (SMA). The pair could then rise to the upper resistance zone of USD 48 to USD 49.87.
Stellar price prediction
Stellar
XLM
0.365 €
fell below the 20-day simple moving average (SMA) of USD 0.44 on Monday, and the bears defended the level during a retest on Tuesday.
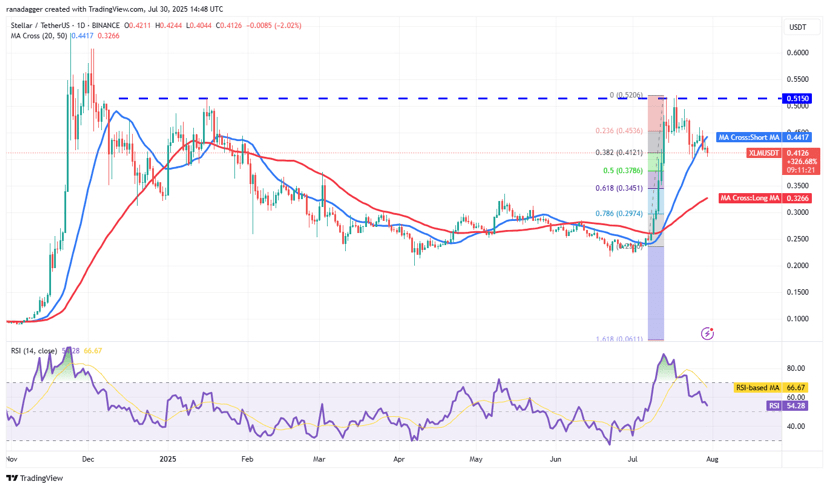
Daily chart of the XLM/USDT pair.
Sellers will try to reinforce their position by pushing the price below USD 0.40. If they succeed, the XLM/USDT pair could fall to the 50% Fibonacci retracement level (USD 0.37) and then to the 61.8% retracement level (USD 0.34).
It is likely that buyers have other plans. They will try to push the price above USD 0.46. If they succeed, the pair could retest the upper resistance of USD 0.52. The next stage of the rally to USD 0.64 could begin with a close above USD 0.52.
Sui price prediction
Sui
SUI
3.33 €
broke above the resistance of USD 4.30 on Sunday, but the breakout turned out to be a bull trap, as the price fell sharply on Monday.
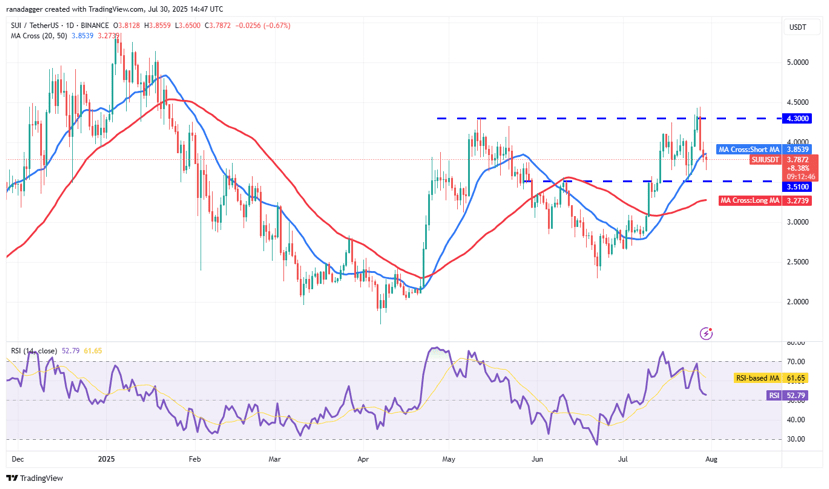
Daily chart of the SUI/USDT pair.
Bears are trying to keep the price below the 20-day simple moving average (SMA) (USD 3.85). If they succeed, the SUI/USDT pair could fall to USD 3.51. Buyers are expected to strongly defend the area between USD 3.51 and the 50-day simple moving average (SMA) (USD 3.27).
If the price rises from USD 3.51 and surpasses the 20-day simple moving average (SMA), this would suggest a potential range formation. The pair could oscillate between USD 3.51 and USD 4.30 for some time. A breakout and a close above USD 4.30 could initiate a new bullish trend towards USD 5.
If you liked the information, you can support me a lot by liking and following me!!!!