In the cryptocurrency world over the years, I've seen too many people rush in with dreams of 'getting rich overnight,' only to lose everything in various flashy operations. I was once one of them—high-frequency trading*, altcoin* speculation, following so-called 'masters' to chase highs and lows. The more I tried to make quick money with my 'cleverness,' the faster I lost it.
Until later, I completely changed my mindset, relying instead on a 'simple method' to gradually generate profits.
Newbies in cryptocurrency trading can become veterans by mastering these nine golden rules!
After so many years of trading cryptocurrencies, if you still haven't made a million, listen to me. The following ten pieces of advice will surely make a difference if you follow them.
1. If you don’t have much money, you need to budget carefully. Throughout the year, catching one major surge opportunity is enough. Don’t always operate with full positions; keep some cash on hand just in case.
2. Cognition determines how much money you can make. If you don't understand, you won't earn. Simulated trading is okay for practice, but when it comes to real money transactions, the psychological pressure can be immense.
3. When encountering good news, if you haven't sold on that day, you should quickly withdraw when the price opens high the next day. Once good news is out, everyone thinks about selling, so the price naturally falls.
4. As holidays approach, reduce positions a week in advance, or simply hold off on selling. The market is inactive during holidays, and prices are prone to large fluctuations.
5. For medium to long-term trading, you must have cash on hand. When prices rise, sell; when prices drop, buy. This can lower costs and allow for strategy adjustments at any time.
6. For short-term trading, find those cryptocurrencies with active trading. If the cryptocurrency has no buyers or sellers, you are likely to get stuck once you buy.
7. Remember this rule: things that fall slowly will generally rise back slowly; things that fall sharply usually rebound quickly.
8. Stop-loss is very important; if you buy incorrectly, you must acknowledge it and quickly stop-loss. Don't think about waiting for the price to return; preserving your principal is key.
9. For short-term trading, frequently check 15-minute K-line charts, and combine with KDJ indicators* to find buy and sell points. Especially when KDJ is overbought or oversold, the signals are particularly accurate. Also consider MACD+, RSI* and other indicators.
In the trading market, what truly affects trading is the investor's interpretation of the K chart. K-lines are the core content of technical analysis, and all technical indicators and methods of technical analysis revolve around K-lines.
Whether you are an expert or a forex novice, most technical analysts study K-lines to understand the hidden information behind them, such as trend strength, buying and selling dynamics, and potential future trend directions, and thus engage in trading.
Although many secrets are hidden in K-lines, not everyone can understand them. Especially for some novice friends, they only see lengths and colors in K-lines without recognizing the information behind them, making trading quite difficult.
Today, let's take a look at how a seasoned expert, who has rooted in the futures market for many years, interprets K-lines. I hope this can help you with your trading!
01 K-line language
K-line is the basic unit that makes up charts; it is the most direct expression of trend changes. The 易象 theory divides changes in K-lines into three types: simple and complex alternation, large and small alternation, and yin and yang alternation.
Through these three alternating patterns, we can predict the market's next changes under specific conditions.
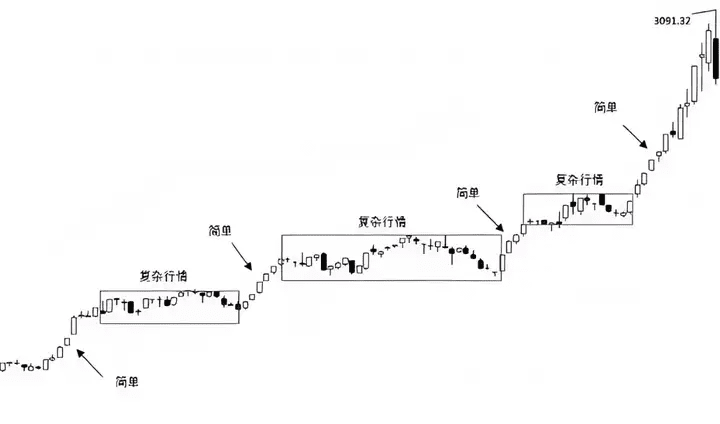
1 Simple language complex alternation
Simple and complex represent the alternating process of K-line movement patterns. We control trading rhythm through the alternation of simplicity and complexity.
Simple market: clear trend.
During the upward process, the data of bullish lines significantly outweighs that of bearish lines, with the amplitude of bullish lines generally larger than that of bearish lines, closing as a bullish line or having the next K-line not break the lowest point of the previous K-line; conversely during the downward process.
Complex market: unclear trend.
Yin and yang K-lines are basically balanced in quantity and amplitude, with K-lines fluctuating within a limited area.
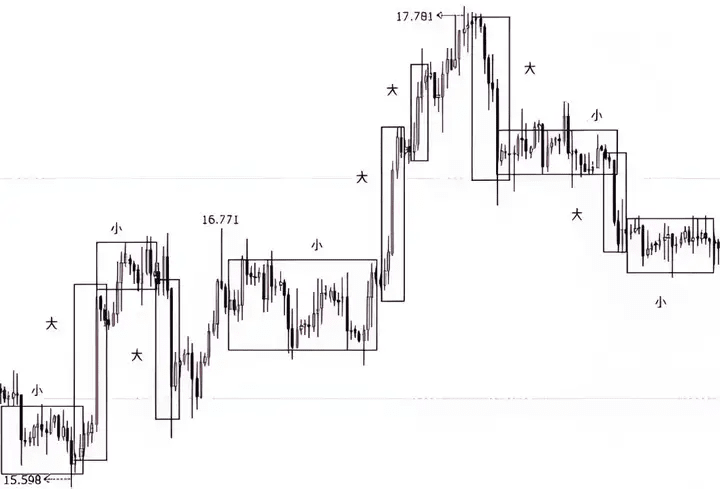
2. Large and small alternation
Large and small alternation reflects the alternating process of K-line amplitude. We look for entry opportunities and control greed and fear during the large and small alternation.
Large amplitude: one or several consecutive K-lines have an amplitude larger than surrounding K-lines, indicating a strengthening of one side’s power in a specific time area.
Small amplitude: one or several consecutive K-lines have an amplitude smaller than that of surrounding K-lines, reflecting a weakening of one side's power or a balance of power in a specific time area.
Large and small alternation patterns: 1. Large and small alternation; 2. Large (yin and yang) — large (yin and yang) alternation; 3. Small (yin and yang) — small (yin and yang) alternation.
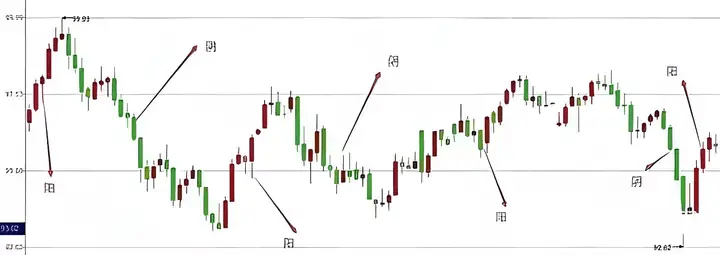
3 Yin and yang alternation
Yin and yang alternation represents a change in market direction. When yin and yang alternation occurs, it indicates that a turning point in market fluctuations may appear, allowing one to seek trading opportunities.
Only K-line conversions between structural positions may have trend-changing significance.
02 Structural language
Dow Theory* initially discussed the three rises and three falls structure of market sentiment. Wave Theory* afterwards further subdivided the market structure. The most precise theory for explaining structures currently is Wave Theory.
However, there are some problems in the practical application of wave theory. Before the trend ends, everyone's understanding of the five waves differs. According to different principles, wave types can be classified into different standards.
易象 theory simplifies waves, not discussing wave subdivisions but focusing on the primary and secondary relationships of adjacent segments to determine changes in market movement direction.
1 Segment
Segments are the most basic components of the structure, consisting of multiple K-lines. The line connecting the highest point (lowest point) to the lowest point (highest point) forms a segment.
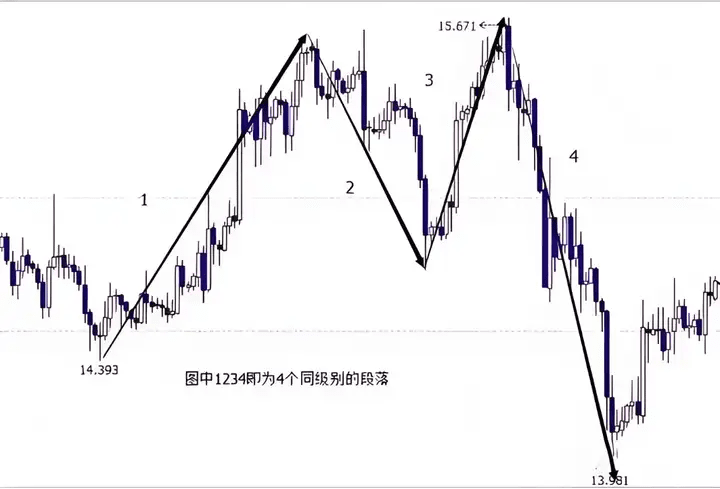
2 Primary and secondary structure
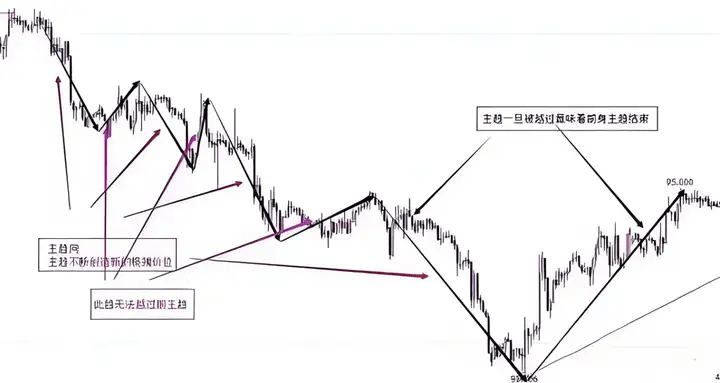
By comparing two adjacent segments, the longer segment is the main trend segment, while the shorter segment is the secondary trend segment. After the secondary trend segment, a main trend segment is expected to appear, and after the main trend segment, a secondary trend segment is expected to appear.
The alternating appearance of primary and secondary segments reflects the overall movement direction of the market.
Moving towards the main trend direction until the starting point of the main trend segment is broken, altering the relationship between adjacent segments, indicating that the market may experience a reversal. As shown in the figure:
The specific description is as follows:
1. Main trend segment
Continuously operating below or above the medium and long-term moving averages;
Backtesting does not make substantial breakthroughs in higher-level structures or damage the technical pattern significantly.
Strong directionality, constantly creating new extreme prices;
Provide real confirmations for technical displays.
2. Secondary trend segments: are retracements of the main trend segments and cannot break through the limit price of the primary main trend segments.
03 Ratio language
Proportions are points of balance and breakthrough that are easily achieved through the comparison and competition of forces in nature. Proportion positions can serve as balance points for mutual forces or as explosive points for unilateral forces.
It is essential to distinguish between primary trend proportions and primary-secondary proportions:
Proportions between main trends: less than, equal to, greater than.
Proportions between primary and secondary: golden ratio*, deep and shallow.
The endpoint of the main trend segment can be confirmed by the disappearance of inertia, while the endpoint of the secondary trend requires confirmation by the golden ratio, with retracement amplitudes divided into deep and shallow.
1
Golden ratio
The golden ratio, also known as the golden law, refers to a certain mathematical ratio relationship among various divisions of physical objects, which divides the whole into two, where the ratio of the larger part to the smaller part is equal to the ratio of the whole to the larger part.
The ratio of the golden ratio is 1:0.618 or 1.618:1, meaning the long segment is 0.618 of the whole segment. 0.618 is recognized as the most aesthetically meaningful ratio.
The aforementioned ratio is the one that most evokes human aesthetic feelings, hence it is called the golden ratio.
When the main trend segment is confirmed and the secondary trend segment begins, the end point of the secondary trend segment is often at the golden ratio level of the main trend segment.
The end point of the next segment or multiple segments of the main trend is often an extension of the current main trend segment's golden ratio.
Golden ratio retracement levels: 23.6% 38.2% 50% 61.8% 76.4%
Golden ratio extension levels: 161.8% 261.8% 423.6%
If the golden ratio is effective (the expected resistance and support levels are valid), then at the golden ratio level, there may appear: 1. Yin and yang conversion 2. Large and small alternation (deep and shallow retracement alternation, with a long first segment followed by a shallow adjustment in the second segment).
2
Deep and shallow
The retracement ratios of secondary trend segments often show deep and shallow retracements.
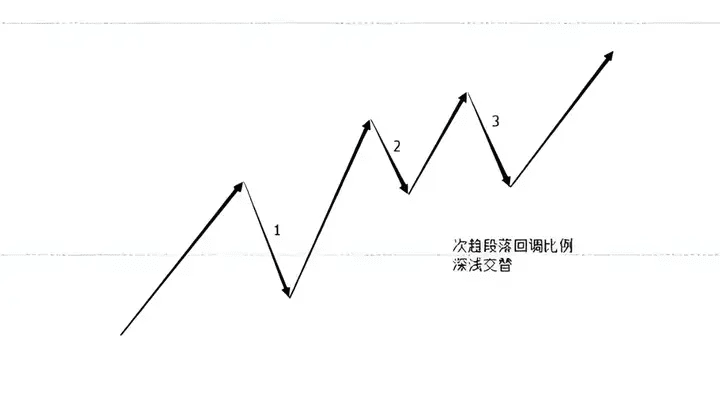
When using the golden ratio: its proportion generally shows shallow retracement around 38.2% and deep retracement around 61.8%. In strong trends, retracements may occur around 23.6% before contracting.
When using moving average groups* for judgment: shallow retracements end between the 14 and 27 moving averages of the medium-term band, while deep retracements end between the 52 and 60 moving averages of the long-term band.
04 Cycle language
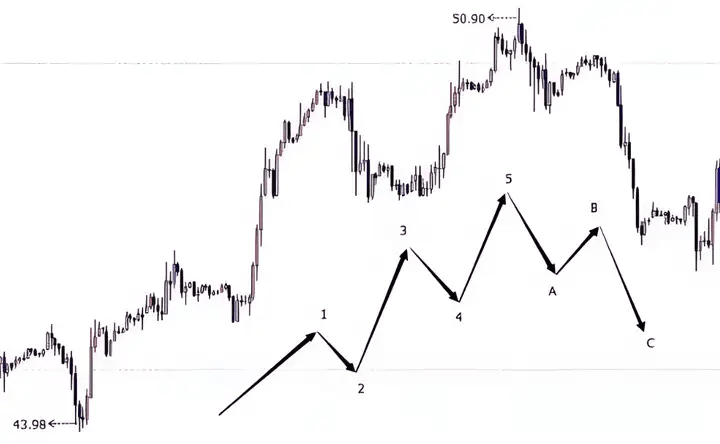
A complete cycle consists of one main trend and one secondary trend. The main trend can be divided into primary and secondary segments, totaling 12345 segments, while the secondary trend can be divided into primary and secondary segments ABC.
From the monthly chart, divide the primary and secondary switching cycles (weekly chart, daily chart, hourly chart, minute chart, etc.) to ultimately break down the entire market structure.
Different time period charts:
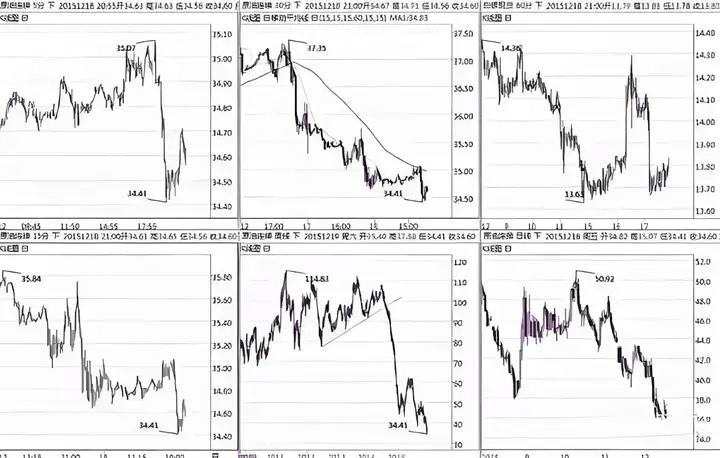
In trading, do not alternate between primary and secondary during the first instance; use the first primary as the basis and combine the segment and ratio to determine the primary trend of segments 3 and 5 and the subsequent secondary trend. (3 opportunities)
05 Indicator language
Technical indicators are mathematical models built on market information, which investors often first encounter when entering the market.
However, many beginners find that after learning numerous indicators, they still incur losses regardless of the indicator used. The primary issue causing this problem is a lack of understanding of the mathematical models and corresponding principles of the indicators themselves.
An indicator generally reacts to only a few specific market patterns; when the factors currently dominating market movement change, the indicator can easily become ineffective.
Indicators can be simply classified into two categories: trend indicators and oscillation indicators.
Trend indicators: can only accurately indicate price direction in simple market conditions;
Oscillation indicators: can only accurately indicate price direction in complex markets.
易象 theory uses only the most basic trend indicators to analyze the market through moving averages, capturing the start of simple trends without refining complex market analyses.
1 Trend indicators
Trend indicators work well in simple markets but become blunt in complex ones. The moving averages used in 易象 theory have two applications:
1. A moving average
In longer-term (4-hour charts) period charts, a short-term moving average (7 moving average) can be used to define the current market situation:
1. In simple markets: observe the direction of the short-term moving average and the relationship between the closing price of the K-line and the moving average.
When the short-term moving average is upward, and the K-line closes as a bullish line, with the closing price above the short-term moving average, the market outlook is bullish.
When the short-term moving average is downward, and the K-line closes as a bearish line, with the closing price below the short-term moving average, the market outlook is bearish.
As shown in the figure:
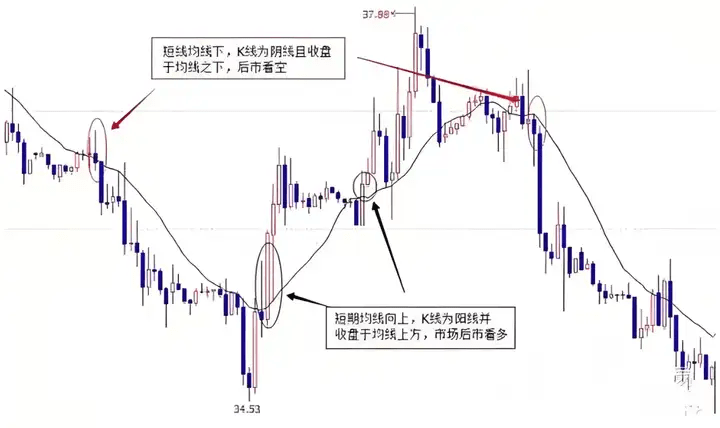
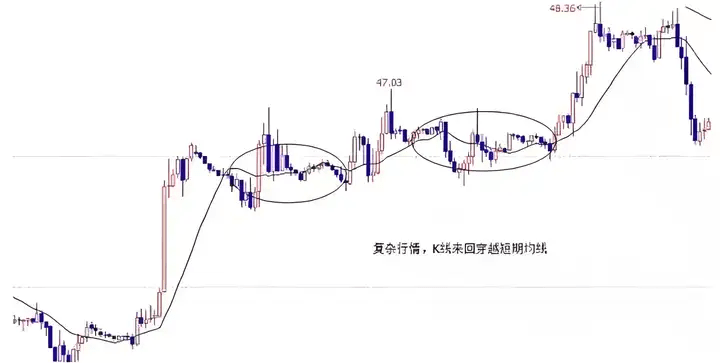
② Complex market: crossing back and forth along the moving averages
2. Moving average group
Using moving average groups to define simple and complex markets can be applied in any cycle, especially in smaller cycles (within 1H), where the stability of the moving average group can filter out many false signals.
The moving average group in 易象 trading consists of five moving averages:
Short-term moving average: The 7-period moving average serves as the short-term moving average, mainly used for profit exits.
Medium-term moving averages: The 14-period and 27-period moving averages form a medium-term moving average band. We refer to the market's retracement levels between the 14 and 27 moving averages as shallow retracements, also known as the 1427 phenomenon.
Long-term moving averages: The 52-period and 60-period moving averages form a long-term moving average band. We refer to the market's retracement levels between the 52 and 60 moving averages as the 5260 phenomenon.
By analyzing the arrangement order and direction of the moving average group, we can determine whether the current market is simple or complex.
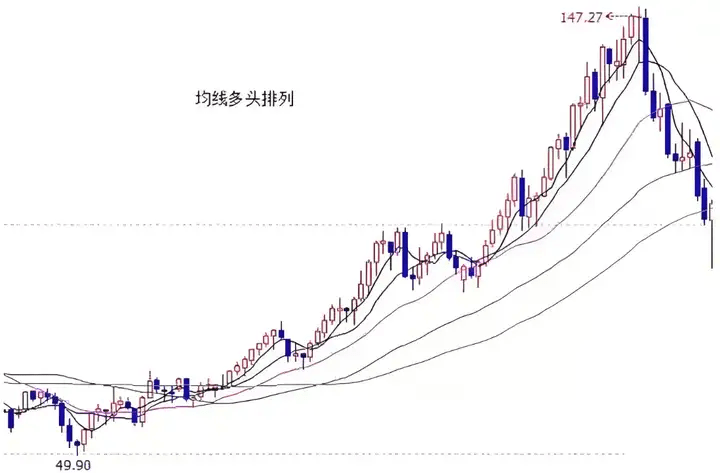
1) Moving averages are arranged in an orderly fashion:
Moving averages shift from intertwining to orderly arrangement, marking the beginning of simple market conditions.
① Moving average group is in a bullish arrangement
② Moving averages are arranged in a bearish alignment
2) Moving averages are arranged in a disorderly manner:
Conflicting directions of each moving average gradually intertwine, marking the beginning of complex market conditions.
When the long-term moving average is upward and the short-term moving average is downward, it generally indicates a transition from bullish to bearish, and vice versa.
2 Oscillation indicators
Common usage of oscillation indicators:
In an upward trend, look for golden crosses at low points; in a downward trend, look for death crosses at high points.
Pay attention to indicator divergence, where the price makes new highs or lows, but the indicator does not; this indicates that the market may be about to reverse.
06 Channel language
Trend lines* are a graphic analysis method that connects low or high points using line drawing to predict the approximate direction for the next day based on already occurring instances.
By accurately drawing trend lines, people can roughly understand the future development direction of market prices. Depending on the duration of the fluctuations, three types of trend lines can emerge:
Short-term trend line (connecting short-term fluctuation points), medium-term trend line (connecting medium-term fluctuation points), long-term trend line (connecting long-term fluctuation points)
1
How to draw trend lines
How to draw support and resistance lines:
Support line: Connect two or more relative low points to get the support line.
Support line
Resistance line: Connect two or more relative high points to get the resistance line.
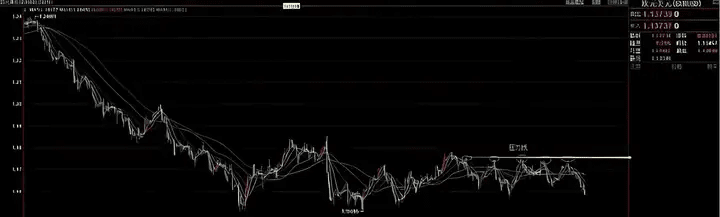
Resistance line
Usage of support and resistance lines:
1. The role of support and resistance lines
Support line is also known as a resistance line.
When the exchange rate drops to a certain price level, it stops falling and may even rebound. This price level, which prevents further declines or temporarily halts the price drop, is where the support line is located.
A resistance line is also known as a resistance line.
When the exchange rate rises to a certain price level, it will stop rising, or even retreat. This price level, which prevents or temporarily halts the further rise of the exchange rate, is where the resistance line is located.
The role of support and resistance lines is to prevent or temporarily halt price movements in one direction. At the same time, support and resistance lines also have the potential to completely stop price changes in the original direction.
2. Support and resistance lines transform into each other
If a support line is broken, then this support line will become a resistance line.
Similarly, if a resistance line is broken, this resistance line will become a support line.
This indicates that the status of support and resistance lines is not fixed but can change, provided they are effectively breached by sufficiently strong price movements.
3. The confirmation and validation of support and resistance lines
Generally, the importance of a support or resistance line's impact on the current situation has three aspects to consider:
The duration of price stay in this area;
The size of the trading volume accompanying the price in this area;
The time distance of this support or resistance area relative to the current period.
How to draw trend lines:
In an upward trend, connect two low points to get the upward trend line.
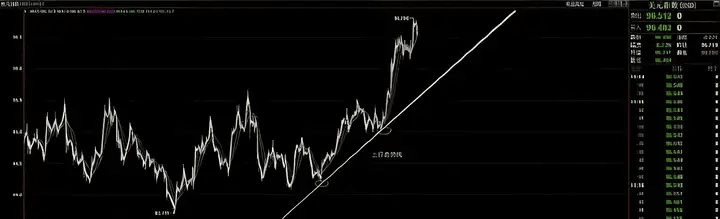
Upward trend line
In a downward trend, connect two high points to get the downward trend line.
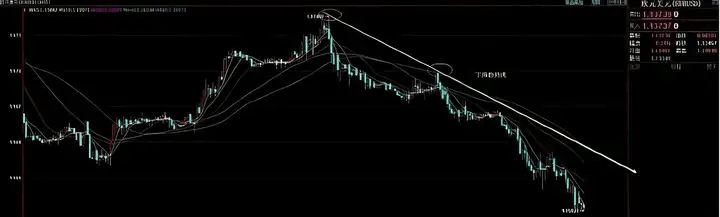
Descending trend line
Usage of trend lines:
Trend lines measure the direction of price fluctuations, and the direction of the trend line clearly indicates the price trend.
To obtain a truly effective trend line, it must be verified from multiple aspects before being confirmed.
A trend must indeed exist.
After drawing a straight line, the verification of a third point is required to confirm that this trend line is valid.
How to draw channel lines:
Channel lines are also known as channel lines or pipeline lines, based on trend lines.
Once the trend line is obtained, a parallel line can be drawn through the first peak and trough; this parallel line is the channel line.
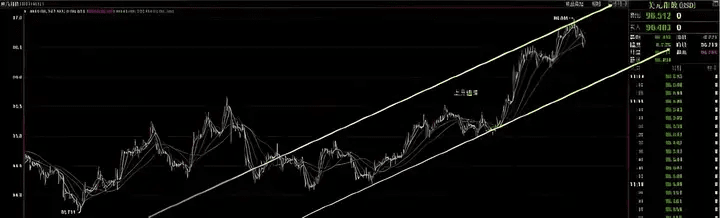
Ascending channel
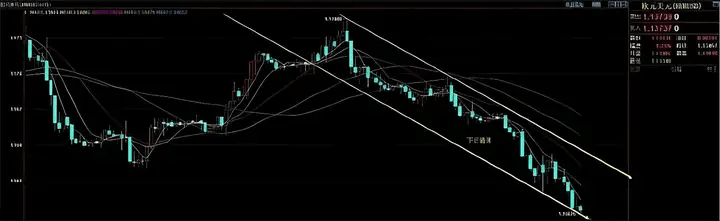
Descending channel
Usage of channel lines:
Two parallel lines form a channel, commonly referred to as ascending and descending channels.
The role of channels is to limit the range of price fluctuations. A breakout above or below the upper or lower line indicates a significant change. Unlike trend line breakouts, a breakout from the channel line does not indicate a reversal of the trend but rather the beginning of trend acceleration.
The channel line has another function, which is to issue alerts for potential trend reversals.
Finally, when drawing these lines, it is essential to pay attention to the choice of time periods. According to theory and experience, the larger the period, the more significant the impact of the drawn line, resulting in a higher success rate in trading. It is recommended to look at the H1 period for intraday trading, and the H4 and daily charts for medium to long-term trading.
2 Typical forms of trend lines
Trend lines can be categorized into platform type, contraction type, and expansion type. Specific examples are shown below:
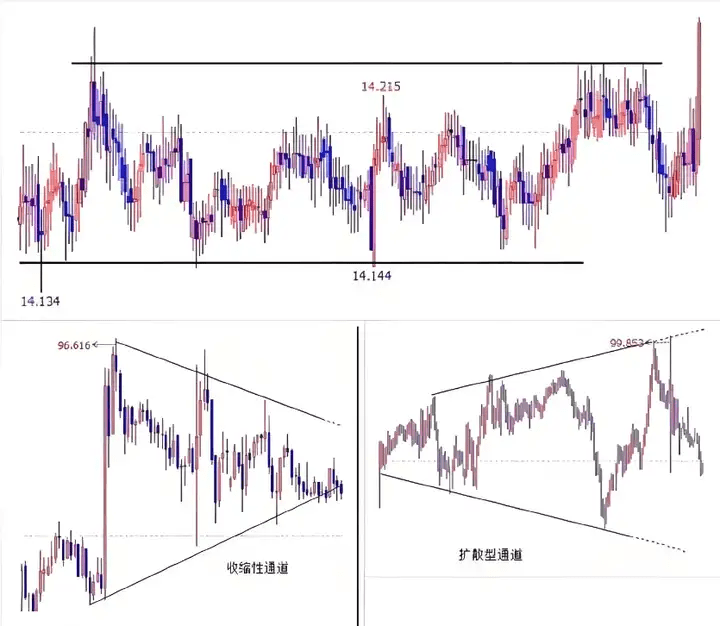
Ultimately, methods are subjective; some might suit you, while others might not. You need to validate these for yourself.
Don't get lost anymore! If you want stable gains, skyrocketing profits, and comebacks, follow my method!
I lead the rhythm, I choose the coins, I set the direction, delivering 2-5 strong signal trades daily with precise tips!
Stop relying on feelings when trading; we rely on discipline and strategy to achieve results!


