#稳定币热潮 After 10 years of trading coins, the capital I saved from working was 68,000, and it is now over 80 million. I only trade spot, not contracts. Although I haven't turned 10,000 into two small goals like some people, I am already very content, stable, and at ease. I dream of breaking 100 million in my account by the end of this year, and next year I will have more capital to earn more money.
When trading coins, it's crucial to maintain a good mindset. During significant drops, don't let your blood pressure rise; during significant gains, don't get carried away. It's important to secure profits. When I first started trading coins, I used to worry so much that I couldn't sleep well, often waking up in the middle of the night. Now, I'm much more at ease.
Ultimately, wanting to make money is not about technique but about implementing my own set of secrets. This statement alone excludes 70% of people. Patterns in candlestick charts that players in the currency circle must know!
1. T-Line (Dragonfly)
• Application Rules:
A reversal line indicating bullish at the bottom and bearish at the top.
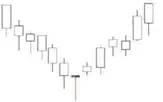
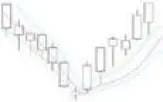
2. V-shaped reversal
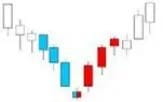
• Application Rules:
The bottom hits the bottom, reverses and rises.
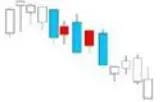
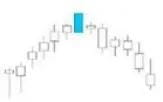
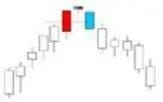
3. Long Upper Shadow
Application Rules:
1. A long upper shadow appearing at a high point in an uptrend, if the trading volume increases, indicates that the bulls are actively chasing higher prices, but there is heavy selling pressure at high levels. The stock price struggles to climb higher, and the market is likely to reverse or pull back.
2. A long upper shadow appearing at a low point in a downtrend, if the trading volume increases, indicates that the bulls are trying to catch a bottom, but are unable to effectively curb selling pressure. Both bulls and bears have gradually turned into a balanced situation.
4. Long Doji
• Application Rules:
1. Doji candlesticks may constitute important warning signals. The original trend pauses or reverses.
2. The doji candlestick only holds significant meaning under conditions where they do not frequently appear in the market.
3. If it has a long upper shadow or a long lower shadow, it further indicates that the market is indecisive, and significantly more than ordinary doji candlesticks, it has greater significance in indicating that the original trend pauses or reverses. The bottom hits the bottom, reverses and rises.
5. Long Lower Shadow
• Application Rules:
1. A long lower shadow appearing at a high point in an uptrend, if the trading volume increases, indicates that selling pressure has intensified, but buying interest is high, although there is a sense of exhaustion among the bulls.
2. A long lower shadow appearing at a low point in a downtrend, if the trading volume increases, indicates that panic selling has occurred, but there is strong buying interest at low levels, with many bulls trying to catch a bottom.
6. Emerging Lotus
• Application Rules:
A large bullish candlestick crossing three moving averages changes the moving averages to a bullish arrangement, suggesting a bullish outlook.
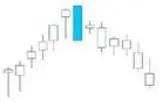
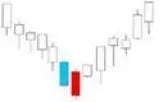
7. Large Bullish Candlestick
• Application Rules:
1. A large bullish candlestick appearing in an uptrend indicates that the market is rising sharply.
2. A large bullish candlestick appearing in a downtrend indicates that the market is rebounding sharply upwards.
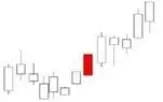
8. Large Bearish Candlestick
• Application Rules:
1. A large bearish candlestick appearing in an uptrend indicates that the market is returning sharply downwards.
2. A large bearish candlestick appearing in a downtrend indicates that the market is plummeting sharply downwards.
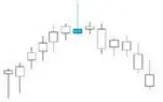
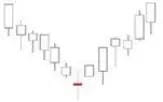
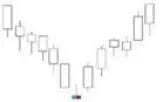
9. Inverted V-shaped reversal
• Application Rules:
Reversal pattern, suggesting a bearish outlook.
10. Inverted Hammer
• Application Rules:
If an inverted hammer appears after a downtrend, it constitutes a bullish candlestick pattern, which is the same as the ordinary hammer line. When analyzing the inverted hammer line, one very important point is that after it appears, you must wait for the next time unit's bullish signal to validate it. The validation signal for the inverted hammer may take the following forms: the opening price of the inverted hammer the next day has an upward gap, exceeding the body of the inverted hammer. The greater the upward gap, the stronger the validation signal. It may also take another form: the inverted hammer the next day is a white candlestick, and its price levels are all relatively high, thus completing the bullish validation signal.
11. Hanging Man
• Application Rules:
1. If the hanging man appears after an uptrend, it constitutes a bearish candlestick pattern.
2. When analyzing the hanging man, one very important point is that after the hanging man appears, you must wait for the next time unit's bearish signal to validate it. The validation signal for the hanging man may take the following forms: the opening price of the hanging man the next day has a larger downward gap, the stronger the validation signal.
3. It may also take another form: the hanging man the next day is a black candlestick, and its closing price is lower than the body of the hanging man, thus completing the bearish validation signal.
12. Overlapping Bullish Cannons
• Application Rules:
Overlapping Bullish Cannons, suggesting an extremely bullish outlook.
13. Overlapping Bearish Cannons
• Application Rules:
Repetition of bearish cannons suggests a high possibility of short-term downward trends.
14. Top Cross
• Application Rules:
Short-term peak, suggesting a bearish outlook ahead.
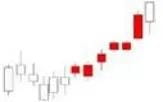
15. Eastern Red Big Bullish Rise
• Application Rules:
Continuous bullish candlesticks, if accompanied by a golden cross in moving averages, suggest a bullish outlook ahead.
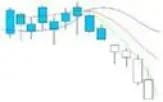
16. Guillotine
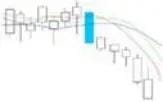
• Application Rules:
A large bearish candlestick cuts through three moving averages, changing the arrangement of moving averages to a bearish arrangement, suggesting a bearish outlook.
17. Bullish Cannon
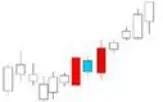
• Application Rules:
Bulls are strong, short-term bullish outlook.
18. Dawn Appears (Counterattack Line)
• Application Rules:
1. The counterattack line pattern appears in a downward trend that transitions from a gentle decline to a sharp drop, indicating that the market will evolve into a V-shaped reversal or a flat trend.
2. The strength of the counterattack line pattern is determined by the depth to which the subsequent bullish candlestick penetrates into the bearish candlestick body. The deeper the bullish candlestick penetrates, the higher the probability that the market will evolve into a reversal or stop-flat trend.
19. Headless Bullish Candlestick
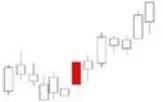
• Application Rules:
The headless bullish candlestick pattern indicates an aggressive upward movement of the bulls. The specific strength of this movement should be determined by the size of the bullish candlestick body.
20. Headless Bearish Candlestick
• Application Rules:
A headless bearish candlestick pattern indicates a decisive stance of the bears. The specific strength of this stance should be determined by the size of the bearish candlestick body.
21. Evening Doji Star
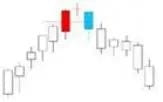
• Application Rules:
1. The judgment rule for the Evening Star is the same as that of the Evening Doji Star.
2. The Evening Star has more significance for trend pauses or reversals compared to the Evening Doji Star.
22. Evening Star
• Application Rules:
The key point of this pattern lies in the degree to which the black body of the third day penetrates the white body of the first day.
Below are some reference factors. If the Evening Star pattern has these characteristics, it helps increase the chances of forming a reversal signal. These factors include:
(1) If there is a price gap between the body of the first candlestick and the star line, and there is also a price gap between the body of the star line and the body of the third candlestick;
(2) If the closing price of the third candlestick penetrates deeply into the body of the first candlestick (generally should be greater than 50%);
(3) If the trading volume of the first candlestick is relatively light, while the trading volume of the third candlestick is relatively heavy.
23. Golden Spider
• Application Rules:
Long, medium, and short-term moving average golden crosses suggest a bullish outlook.
24. Nine Yin White Claw
• Application Rules:
Continuous bearish candlesticks and moving average death crosses appearing together predict a grim future trend.
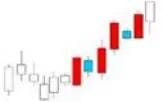
25. Dramatic Rise with Parallel Reds
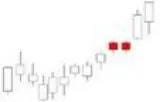
• Application Rules:
Dramatic Rise with Parallel Reds (Parallel Bullish Candlestick) - also known as 'Parallel Bullish Candlestick K Line, Two Bullish Candlesticks Jumping Over a Flat Bottom.'
This pattern consists of two adjacent bullish candlesticks that have the same opening price. Their bodies also have similar heights.
In an uptrend, if a group of parallel bullish candlesticks appears with upward gaps, it constitutes a bullish continuation pattern.
Large cycle looks at trends while small cycle looks at entry points (with diagram).
Because I need to go out and sunbathe.
Sunbathing for calcium, so there isn't much dry goods. Simplifying complex issues, I won't say much.
The large cycle suppresses the small cycle, while the small cycle guides the large cycle.
How exactly can these two sentences be used? Many people misuse them and say these two sentences are useless, but in fact, they haven't found the method.
The large cycle suppresses the small cycle, which means you shouldn't trade against the trend. If the large cycle is bullish, you shouldn't short; if the large cycle is bearish, you shouldn't go long.
The small cycle guides the large cycle, indicating that its trend may reverse.
Let's take a look at the chart.
The black segment has direction, indicating an upward trend, while the yellow segment is now starting to pull back. At this time, we should apply the first statement: the large cycle suppresses the small cycle. At this point, the small cycle might form a bearish trend, which is quite normal.
When the increase is particularly fierce.
Only when the pullback is healthy can it go further, so this pullback won't go too far. If you want to short, it must be during the current yellow segment cycle to short quickly.
You can't think of shorting far away. After all, this is just a pullback of the black segment. If you hold the idea of shorting far away, a slight lapse in attention could get you stopped out.
So when should you go long? You can observe the end of a small cycle pullback beginning to reverse, which also means the end of a large cycle pullback.
For example, when the price breaks through the high of the small cycle in the picture, it warns that the small cycle price may start to reverse, meaning the small cycle is turning from bearish to bullish.
Then the price of the small cycle begins to turn from bearish to bullish, breaking through the high of the large cycle.
Then in the small cycle, this long position you have taken.
The found point is the reversal point of the small cycle, and following the reversal point of the small cycle also follows the bullish trend of the large cycle's black segment.
This is also how a small cycle guides a large cycle. Look big and do small, following both.
This is also why you shouldn't take counter-trend trades. Often, because of a small counter-trend trade, you miss out on more profits. In trading, what you fear most is trying to catch everything and always wanting to be in the market, which is also why many traders frequently stop-loss.
In trading, you must make some trade-offs. It's not that you shouldn't trade the positions you're not good at; avoid trading counter-trend positions and try to stick to one cycle.
If you persist for a period, capital will definitely grow, but all prerequisites require having your own trading method.
Key position order (with diagram) trading is also an ongoing process of introspection.
Today's main sharing content is the order of key positions.
Divided into three types: horizontal resistance support pressure, channel lines, trend lines.
So the sequence of key positions for these three types is:
1. Horizontal Resistance Support Pressure
2. Channel Line
3. Trend Line
Below, we will use chart examples to understand them in order.
1. Horizontal Resistance Support Pressure
Horizontal resistance support is horizontal support and pressure.
As shown in the figure, this kind of pressure support has the greatest relative effect.
Ranked first.
2. Channel Line
Are you really using the channel line correctly?
During an upward trend, the bottom is the trend line, and the top is the channel line.
During a decline, the bottom is the channel line, and the top is the trend line.
During the trading process, we often use the channel line for overshooting. It ranks just below horizontal resistance support.
Next, let's understand the last trend line.
3. Trend Line
The trend line is a topic of much debate and varies from person to person; everyone draws it differently.
When drawing trend lines, it is important to focus on a few points: 1 and 2 points only verify; they do not constitute the correct drawing method of trend lines. Three points in a line are required to meet the correct drawing method of trend lines.
What does it mean? Looking at the chart, when the price reaches label 2, the trend is drawn, and it requires verification at position 3.
The trend line is only valid after verification at point 3.
2. Points to Note
In the chart, both trend lines are actually valid trend lines. Which one will you prioritize in trading?
Whether it's number 1 or number 2, essentially there isn't a right or wrong fundamentally. But remember, trend lines also have a time sensitivity; you can't just draw a trend line and use it as a main reference. More importantly, the current price trend is vital.
The previous chart analysis is complete.
The key main-sub analysis of trading is a method used to identify and evaluate the main and secondary factors in trading. In a trading process, many factors can affect the success or failure of the trade. By conducting a main-sub analysis of these factors, we can better understand the key points of trading and thus make wiser decisions.
and be able to grasp and respond more precisely to various potential risks and opportunities during the decision-making process. Through scientific and comprehensive analysis, the success rate and effectiveness of trading can be improved, thus achieving sustainable development.
Trading is an ongoing process of introspection.
Need to exercise your trading skills.
Need to learn position management.
Need to learn to make choices and give up trades you're not good at.
Need to learn patience, waiting for trades you're good at.
Need to learn to control greed; when to walk away, absolutely do not be stubborn.
Need to bow to the market.
Need to continuously recognize and correct mistakes.
Need to know that money is more important than a single order.
Need to self-comfort and self-heal.
Need simplicity in complexity.
Need self-confidence.
Need self-restraint.
Need to block external voices; trading requires independent thinking.
Need to understand to extend the timeline, giving up the idea of making a lot of money immediately.
In this puzzle of trading, the answer may not be found in a short time, but as you grow, you will definitely find the answer.
Trading is a self-game. In this game process,
you not only improve your trading skills but also enhance your inner self, which will make you better, and your life will improve.
Blockchain circle: Don't let your mindset blind you when trading coins. Tips for making money shared by trading experts!
In this world, everything can be arranged, except your heart. Losing anyone in this world is not scary; what's scary is losing yourself. There is still a long, long road ahead, and you must walk it alone, relying on your own ability to complete it. The world won't give you a return just because of your efforts, nor will it require others to treat you the same way you treat them. The hardest thing about living in this world is maintaining a sense of humility and peace, and this humility comes from genuine sincerity and solid effort.
You must believe that every person and event you encounter in life has its value and significance. Some people teach you love, some events teach you growth, and even if they leave a shallow mark on your path, it's still a rare treasure. At least at some point in the past, you understood life, and you understood yourself. Let's think this way: effort with results is practice, while effort without results is training. Regardless, every encounter is an indispensable element of your life.
Without a high winning rate contract trading system and perfect capital management, it's hard to have a good mindset. Don't tell me you're holding a losing position and your mindset is great; I can only say you've reached the peak of losing money and can deceive yourself!
Mindset = Excellent capital management + Winning rate > 30% trading system.
Among the winners in the contract market of the currency circle, technique is secondary; the core of their trading is capital management, risk control, and trading strategies.
The reason they can earn money is that losers do not execute, or do not strictly execute, or do not comprehensively implement capital management, risk control, and trading strategies.
When two armies face off, if technical analysis is a weapon, both sides are definitely evenly matched; however, if one side believes that in a face-off between two strong forces, the brave will win, and recklessly charges in despite heavy fire, they will surely be defeated. They didn't lose due to weaponry but due to a lack of understanding of defense and protection, combat strategy, and troop utilization. In our trading, this translates to risk control, trading strategy, and capital management.
If everyone strictly, scientifically, reasonably, and comprehensively executes and adheres to capital management, risk control, and trading strategies, only then can technical analysis play a role in determining win-loss patterns.
Seeing this point, winners only focus on capital management, risk control, and trading strategies while never nitpicking on technical analysis. Their requirements for technical analysis are coarse. This is enough to keep them winning for 10 to 20 years continuously. Their vision is broad, and their artistic conception is profound, which is unmatched by traders who only focus on technical analysis.
Failed traders do not understand what forces influence trading. They get lost in piles of technical analysis books.
The reason why losers and winners are on par in technical analysis is also due to the inherent limitations of technical analysis itself. For example, according to Dow Theory, a trend can only be confirmed after the market has moved 30%, which means missing the opportunity to buy low and sell high.
Ultimately, technical analysis is a probability problem. No matter how good your skill is, it only means a slightly higher success rate, around 50%-60%. If their skill is poor, it is just a little worse, with a success rate of around 40%-50%, not much difference.
For example, if a segment of the trend peaks after moving about 30%, there shouldn't be much disagreement about the top. A portion of traders with differing opinions will say it's close to the top. From the overall trend perspective, the viewpoints are basically the same, and disagreements can be disregarded, not leading to a win-loss gap.
However, if you enter here with all your funds and heavy positions, the problem arises: our traders participate in trends and can see the larger direction correctly, but when they enter with heavy positions, they get shaken out by small adjustments and lose money. A moment of distraction can lead to missing the trend, which is very regrettable.
Building positions lightly isn't scary because losses are minimal. Just follow the market, and you won't get shaken out or stopped out. This way, you can ride the trend down and with small positions manage dynamically, increasing and decreasing positions as needed, thus making big profits.
The difference in technical levels between both sides is at most 30%. If you consider yourself skilled and enter heavily without executing capital management, those with slightly lower skill levels are comparatively self-doubting, trying small positions while managing capital.
In the end, those who get washed out and lose a lot of money are certainly those with high skill who entered with heavy positions; while those with slightly lower skills will follow the trend down, although profits won't be much. However, they have widened the gap in capital with heavy traders. After a few cycles, over a year or two, the difference between them is like that of beggars and rich people.
So how do we do good capital management? The trading system is the prerequisite for capital management; we need to understand what capital management is. Transitioning from prediction to non-prediction is a hurdle that requires gradual understanding. Once you understand it, you'll naturally get it. Before that, face-to-face explanations for ten days or half a month won’t yield results.
A mature trading system should include capital management, and capital management should not exist independently of the trading system. Remember, it should not be, rather than it cannot. Li Jun personally believes that to accurately understand trading rules systems, capital management concepts, etc.
Starting from risk control to achieve capital management, to make it easier for everyone to understand, Li Jun still uses the moving average trading system and Bollinger Bands discussed earlier, buying on golden crosses, closing long positions on death crosses, and going short.
Assuming the accuracy of the moving average trading system is 30% and the average profit-loss ratio is 7:3, then, without considering trading fees and costs, the entire trading system cannot make money.
How to understand? For example, if you trade a hundred positions, 30 are profitable, and 70 are losing, with an average profit of 70,000 per profitable position and an average loss of 30,000 per losing position, it certainly adds up to nothing.
In practice, trading rules and systems based purely on indicators can mostly only avoid losses.
Assuming that through backtesting long-term historical data, the maximum loss of the system reaches 80%, it can be said that this system not only does not make money but also has a very high risk coefficient. A maximum drawdown of 80% is extremely terrifying.
How to understand this? For example, if you have one million in capital and the maximum loss reduces it to only two hundred thousand, even if the final result is that you can earn back to one million, the risk coefficient during the process is extremely high. It can be said to be out of control, encountering a terrifying black swan, and there is always the possibility of liquidation.
For a system with high risk and low profitability, can it be completely unusable?
The answer is definitely no.
First, we look at the risk. If the maximum drawdown of the system is 80%, can this risk be reduced somewhat?
Of course, it's possible. If you reduce your position size by half, then the overall risk coefficient also reduces by half, and the maximum drawdown becomes 40%.
Next, if we reduce our position to 25%, then the maximum drawdown should also drop to 20%.
When we write 'maximum position control within 10%' as a rule in our trading system, we get a low-risk system with a maximum drawdown of 10% that does not make money.
Note that the "maximum position control within 10%" is a simple and blunt rule in the capital management system, mainly used for risk control.
The control of trading system risks comes from reasonable capital management.
Digressing, everyone knows that you shouldn't trade with all your capital, but most people don't know why you shouldn't. The answer lies here.
Capital management amplifies profits.
For us, a low-risk but not very profitable trading system is actually of little use. To emphasize, how can this system achieve a positive return?
In practical operation, if you do not change the opening and closing rules, you cannot change the 30% accuracy rate. We cannot change the 7:3 profit-loss ratio either. Although it is frustrating, it's not without solutions. We can change the position size. If we can keep the average position of profitable trades at 10% and the average position of losing trades around 5%, then wouldn't we achieve profitability?
Capital management plays a role in maximizing profits here. Good capital management can turn a non-profitable system into a profitable one, and a system that makes small profits into one that makes large profits.
Exploring the world of digital currency is akin to understanding the true essence of life. Once you grasp the wisdom of living, the mysteries of the currency circle will also become clear. The path of simplicity lies in the integration of knowledge and action, allowing for effortless maneuvering and ensuring victory!