25/07/29 BTC daily line false breakdown, monthly line about to close, ETH remains strong
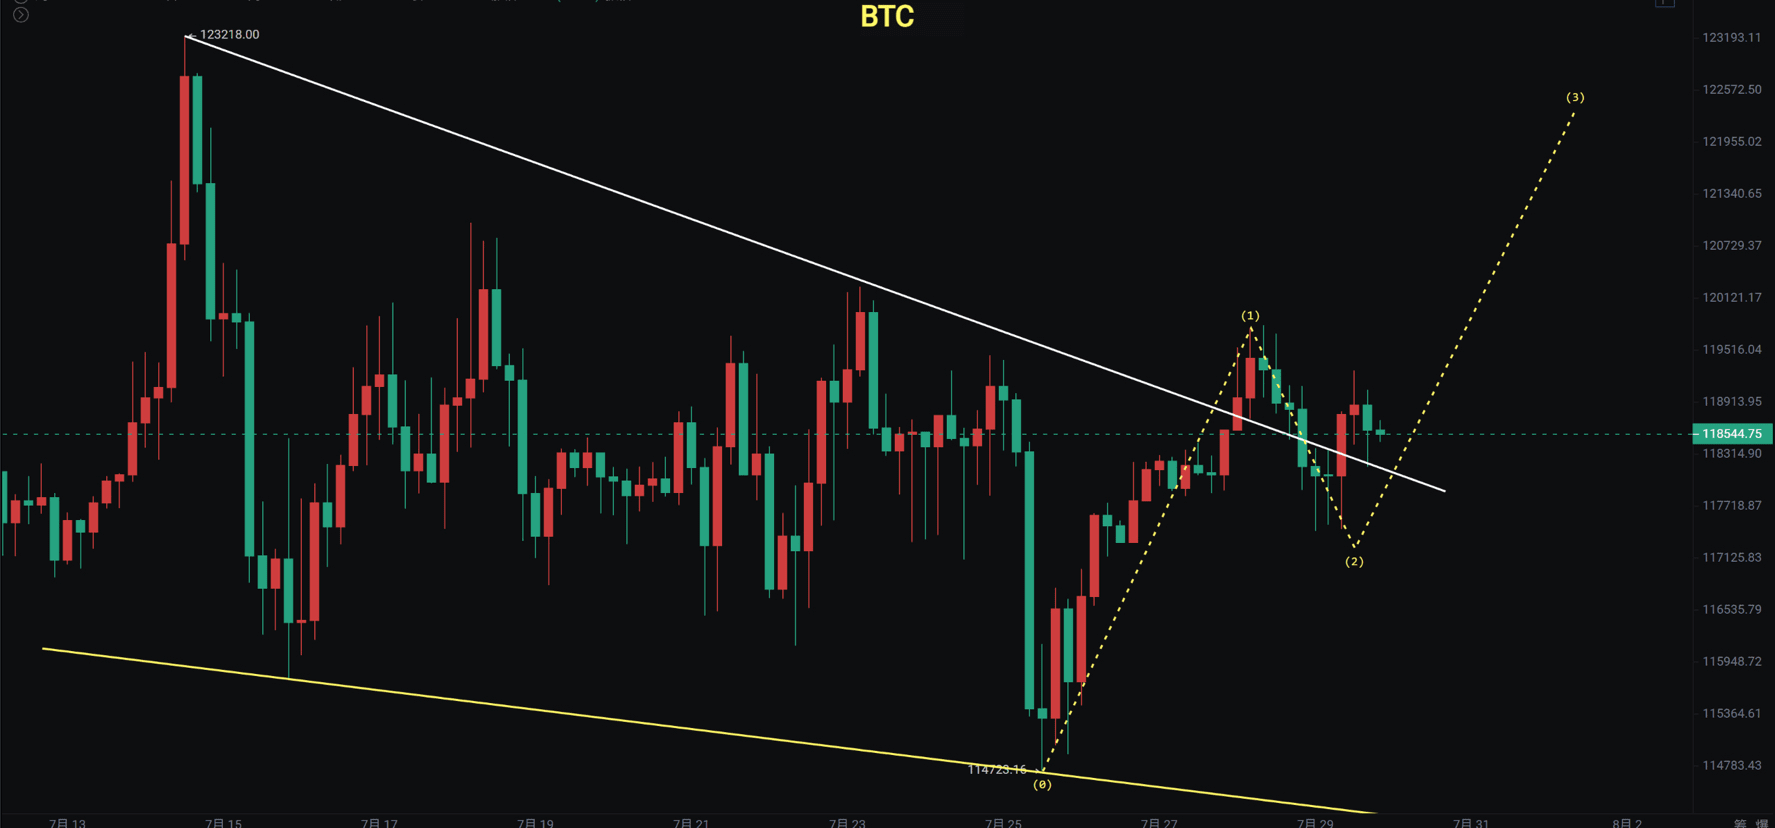
Bitcoin's daily line shows a false breakdown, a 4-hour descending wedge breakout retest, and the monthly line is about to close, so pay attention to the volatility in the next few days. Keep an eye on the changing period in the first week of next month.
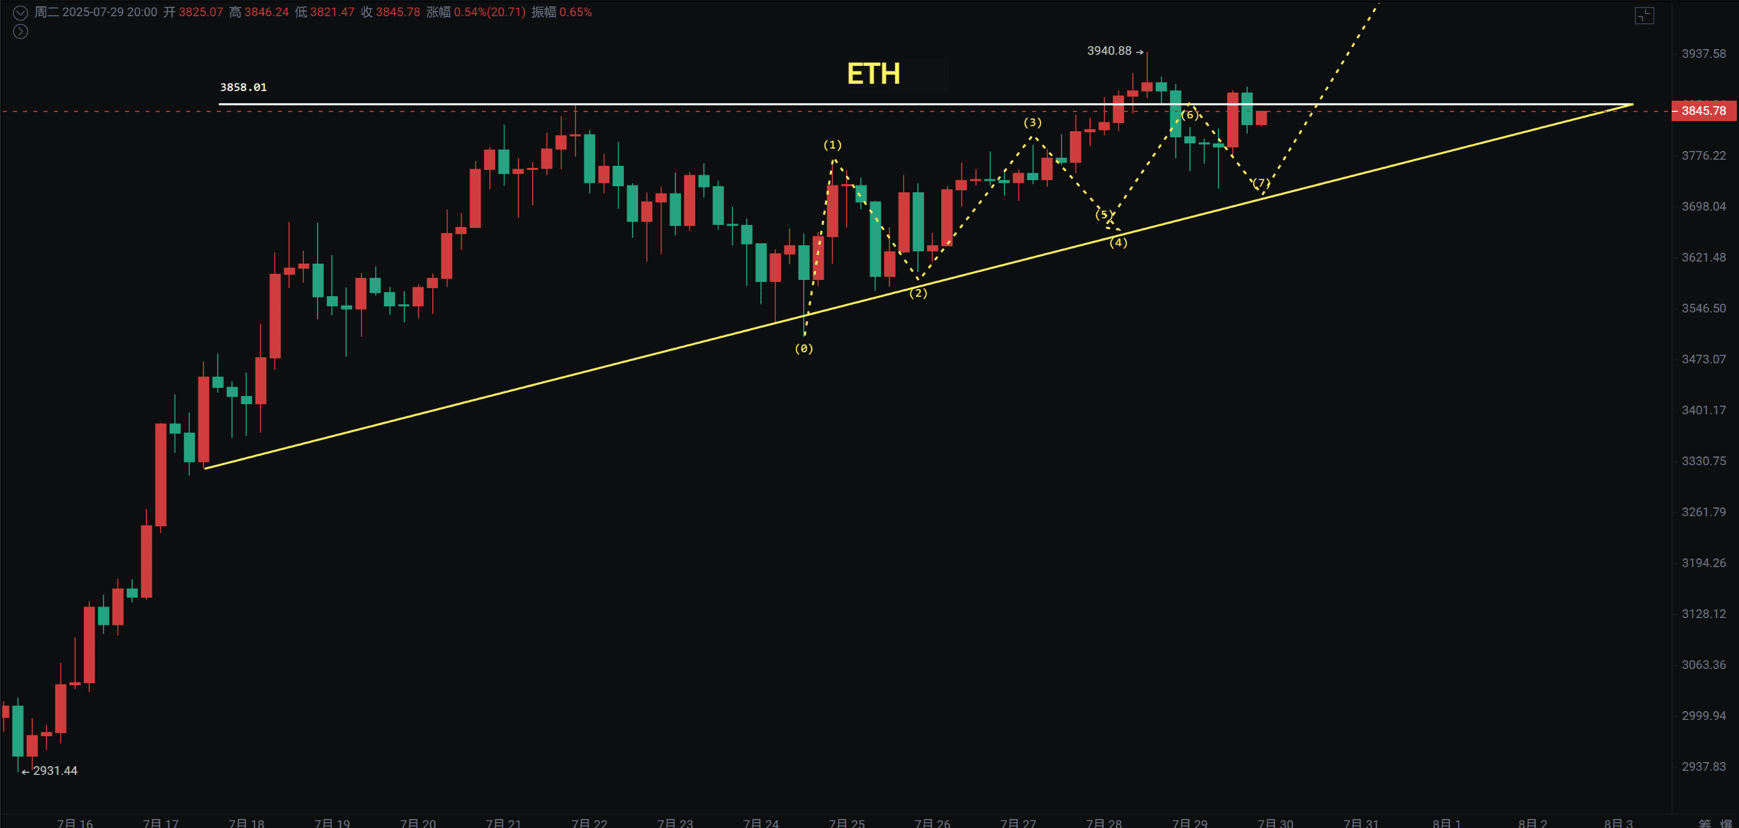
Ethereum reached a new high yesterday, and today it is pulling back, with the lowest drop also around 3700 showing a short-term rebound. The previously mentioned 4-hour ascending triangle is still in operation.
Today I will mention a few indicators. The first is BTC D, the market cap ratio of Bitcoin. Many people feel that Bitcoin has peaked and is about to start a correction. However, my view has always been that since 2021, Bitcoin has been leading the market. Although there has been a ten percent correction in the last week or two, it is still above the ascending trend line and has not broken down. It is also still within this range, so whether it has peaked is still uncertain. If it continues to rebound and cannot create a new high before falling again, then we can consider that the probability of BTC D peaking is relatively high.
The second TOTAL3 altcoin market cap has reached near previous highs, but it still lacks a bit of height to break through. Therefore, it is believed that in the second half of the year, attention should be paid to Ethereum and strong altcoins.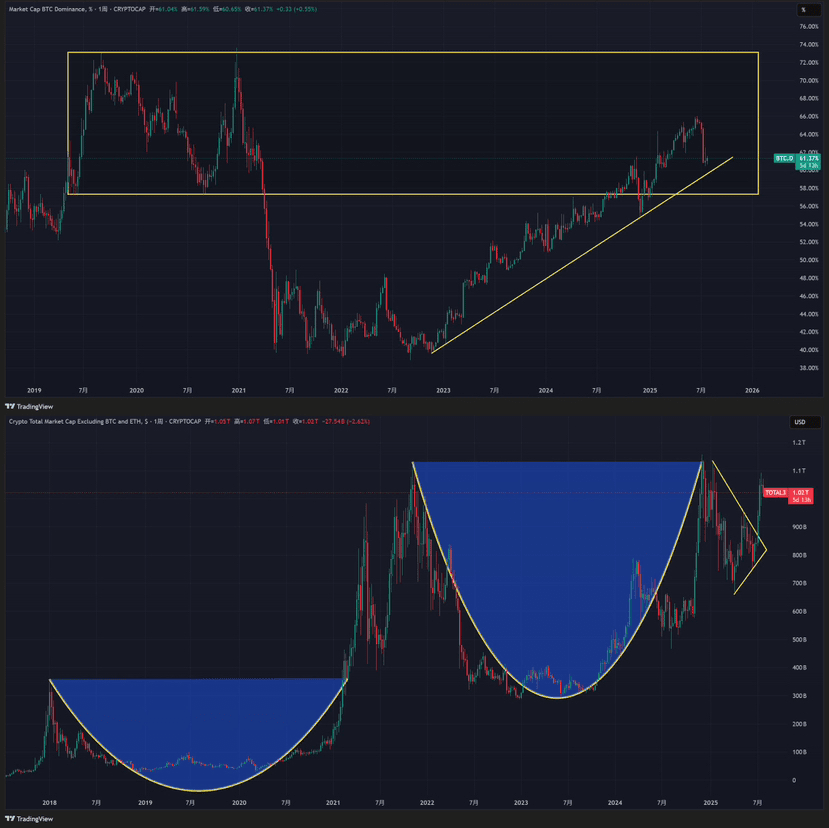
Bitcoin
The weekly chart is closing with a doji star, still showing a relatively strong performance. Although the daily line temporarily broke down and then closed back up, it has not yet broken the resistance at 121000. The daily MACD is still below the zero line with the fast and slow lines crossing. I have been waiting to see if it can flip the zero line to drive the market's activation.
The daily line is oscillating and testing near MA20, but for now, it is still in a sideways trend waiting for direction, with a higher probability of continuing to look bullish.
Support: 114700—115700—117000
Resistance: 121000—123300
Ethereum
The monthly MACD of Ethereum shows a bottom divergence; we need to pay attention to the resistance at 4000~4100. If it breaks through, there’s a chance to reach 4800 or even 6000. Last week on the weekly chart, it was mentioned as a T-shaped line, still indicating a strong signal.
The daily line reached a new high yesterday; today it is correcting, and we need to focus on two support levels of 3700 and 3500. The 4-hour chart shows an ascending triangle, and as previously predicted, the main focus is on when Bitcoin will launch the market to drive Ethereum.
Support: 3500—3700
Resistance: 4000—4100