Can $BTC break higher from here — or is a pullback coming?
---
🔍 Key Watch Points for the Week:
💼 Macroeconomic Moves:
FOMC rate decisions and fresh U.S. economic data could spark market volatility. Bitcoin often leads on sentiment shifts before stocks move.
👥 Institutional Signals:
ETF activity, especially spot approvals or new inflows, remain pivotal. Smart money appears to be quietly accumulating near support zones.
---
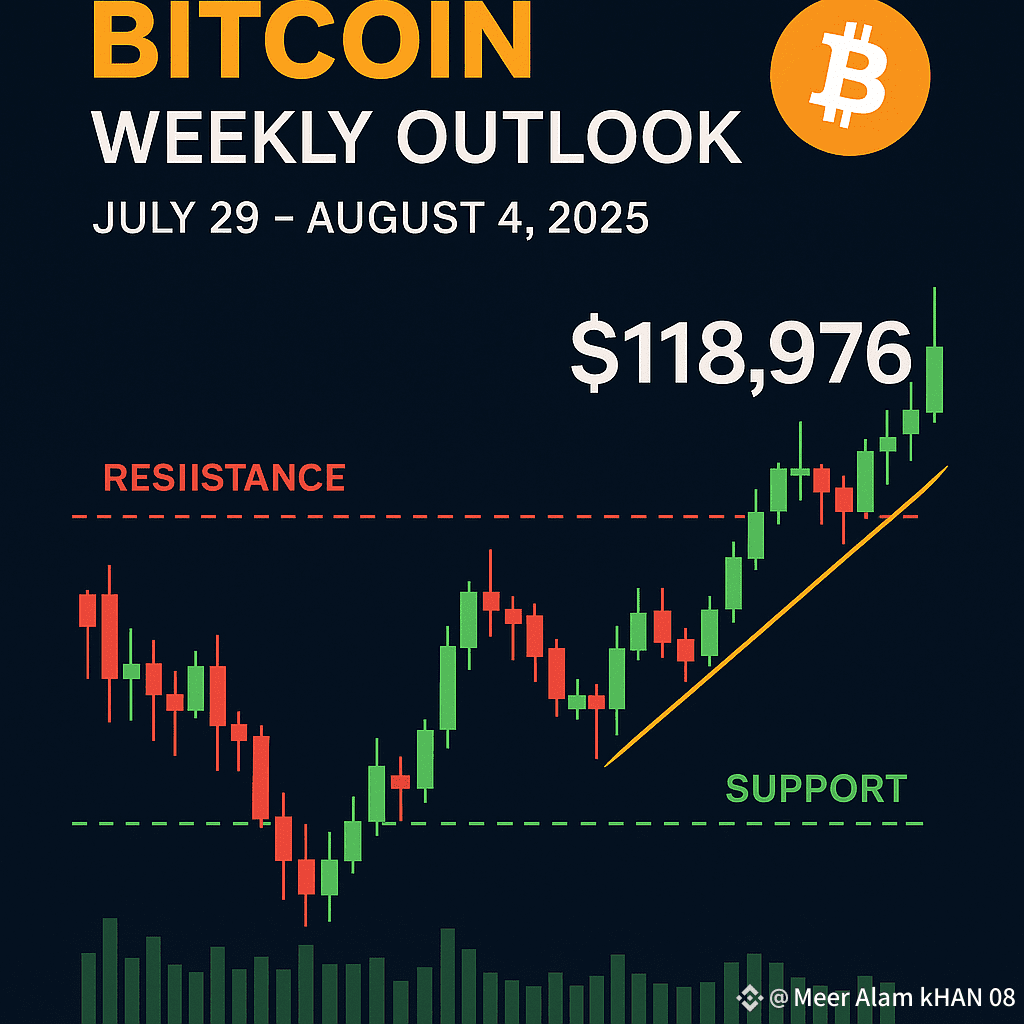
📈 Chart Check:
– Current Price: Around $118,976 (BTC is down ~0.4% in the past 24 hours)
– Support Levels to Watch: $117K → $115K are strong levels for buyers.
– Resistance Levels: $120K → $122K = key upside barriers.
– RSI still below 70, meaning there’s room to run if momentum shifts.
– Green volume pick-up suggests renewed buyer interest.
---
🎯 Weekly Scenarios:
Outlook Target Range
Bullish Breakout $120K – $122K
Pullback & Hold $115K – $117K
Bearish Correction $112K – $110K
---
💡 Trade Smart This Week:
✔️ If $BTC breaks and holds above $120K, expect a move toward $122K.
✔️ A dip into $115K could offer a low-risk entry — watch for bounce signals before entering.
✔️ Always map your risk: tight stop-losses below support zones.
---
✅ Bottom Line:
Bitcoin is flirting with breakout territory but may retrace before climbing. This week will likely set the tone for early August.
Stay informed, manage risk well, and position smartly.
💬 What’s your $BTC target this week?
Share your view in the comments below — let’s trade smarter together.
#Bitcoin #US-EUTradeAgreement #CryptoWeekly #BTC走势分析