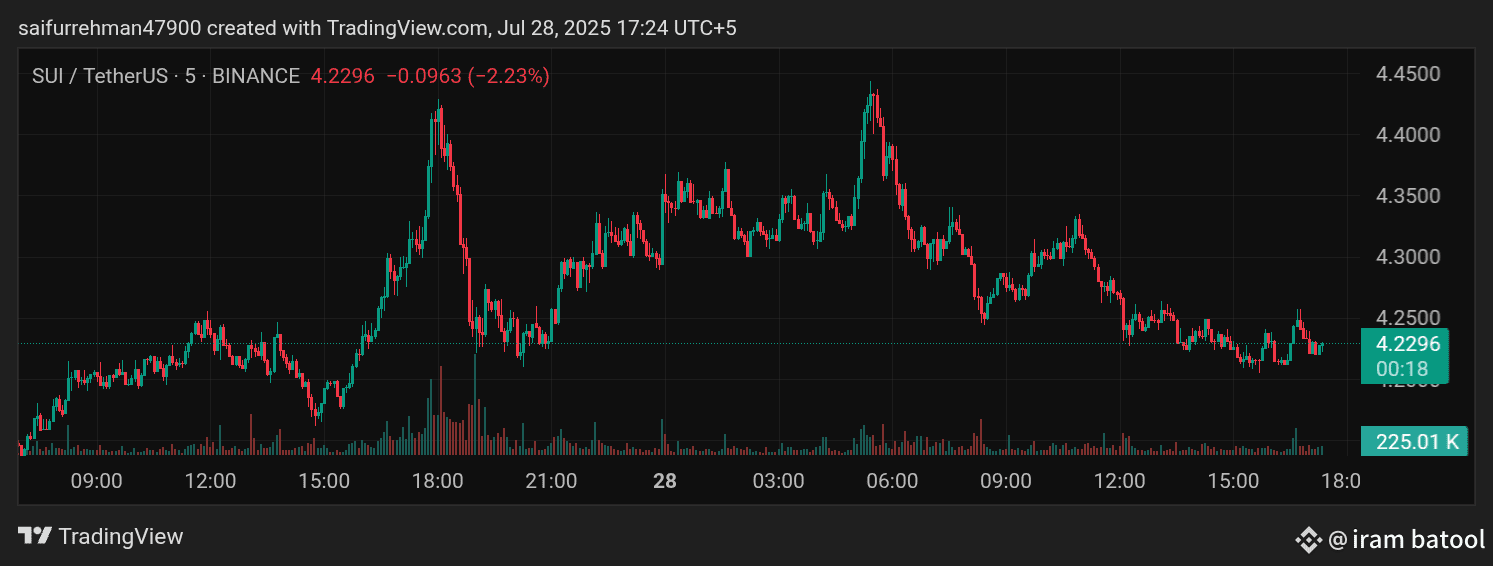
Based on the 5-minute chart for SUI/USDT, here’s a quick analysis:
🔍 Current Market Structure:
Price: $4.2255
Trend: Short-term downtrend after a spike around $4.45
Recent Highs: Lower highs are forming → sign of bearish pressure
Volume: Decreasing slightly, suggesting momentum might be weakening
📉 Price Action Analysis:
Strong rejection from $4.45
Lower highs and lower lows since then
Weak bounce attempts with quick rejections
No clear bullish reversal pattern yet
🔄 Support & Resistance:
Immediate Resistance: ~$4.30
Support Zone: ~$4.18–$4.20
✅ Suggestion (Scalper/Day Trader View):
SELL/SHORT (or wait for better long entry)
Target: $4.18–$4.20 support zone
Stop-loss: Above $4.26 (tight risk management)
Only consider buy/long if price forms a strong base or breakout above $4.30 with volume
Let me know if you're in a trade or want entry/exit strategy based on indicators (like EMA, RSI).