Overall analysis (timeframe 1D and 4H)
Current price: $3,770
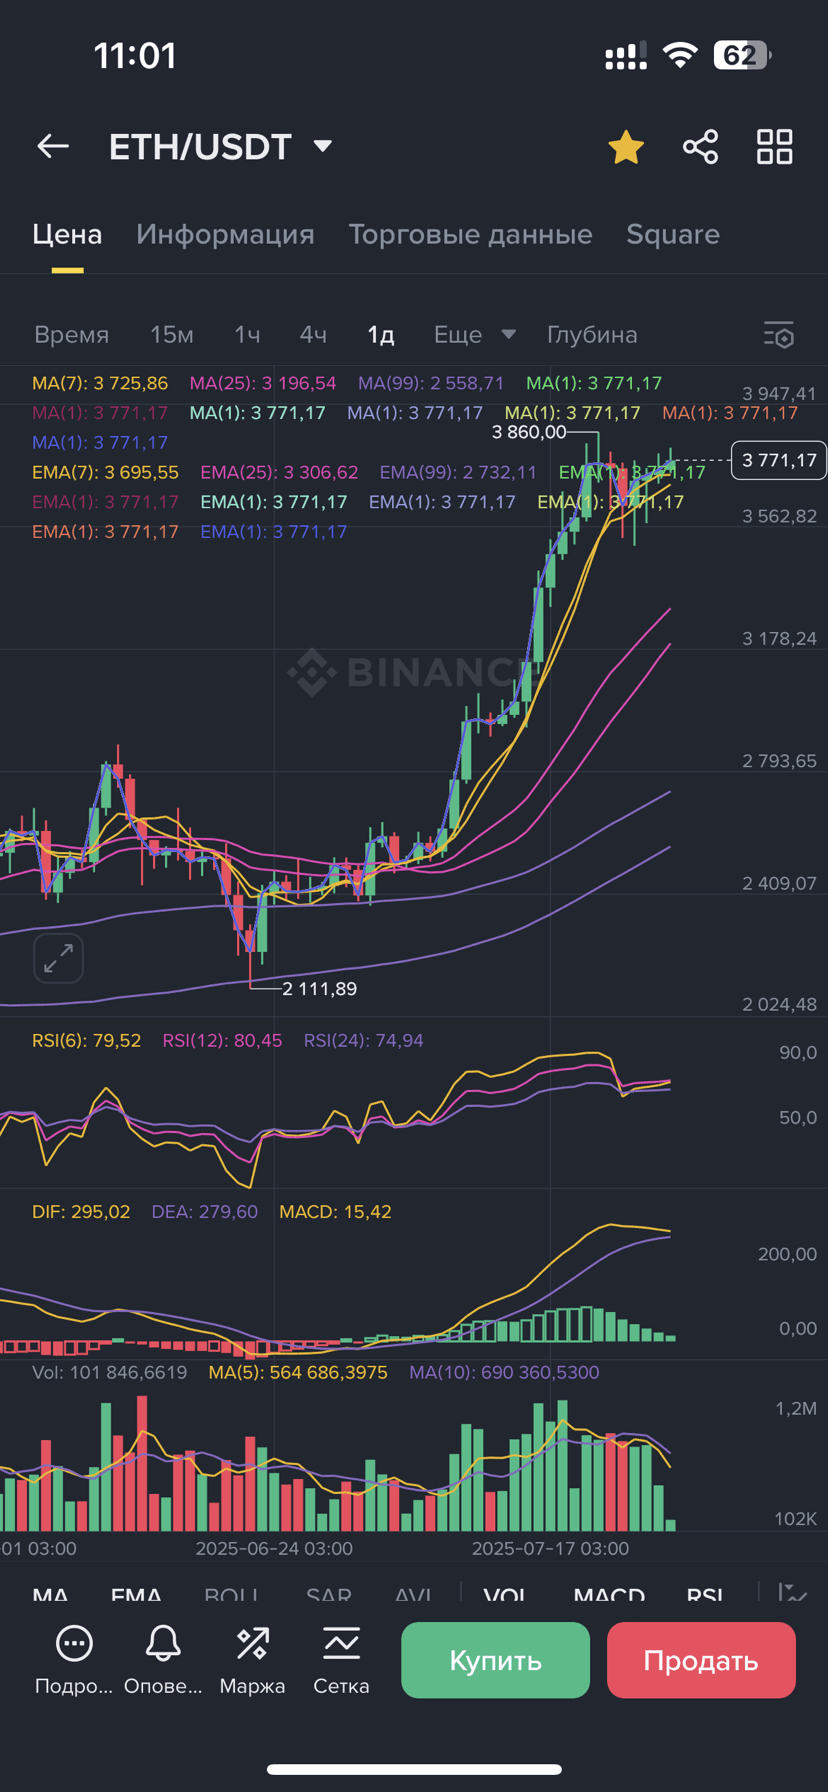
On the daily (1D) — strong bullish trend, but slowing down (RSI 79 — overbought).
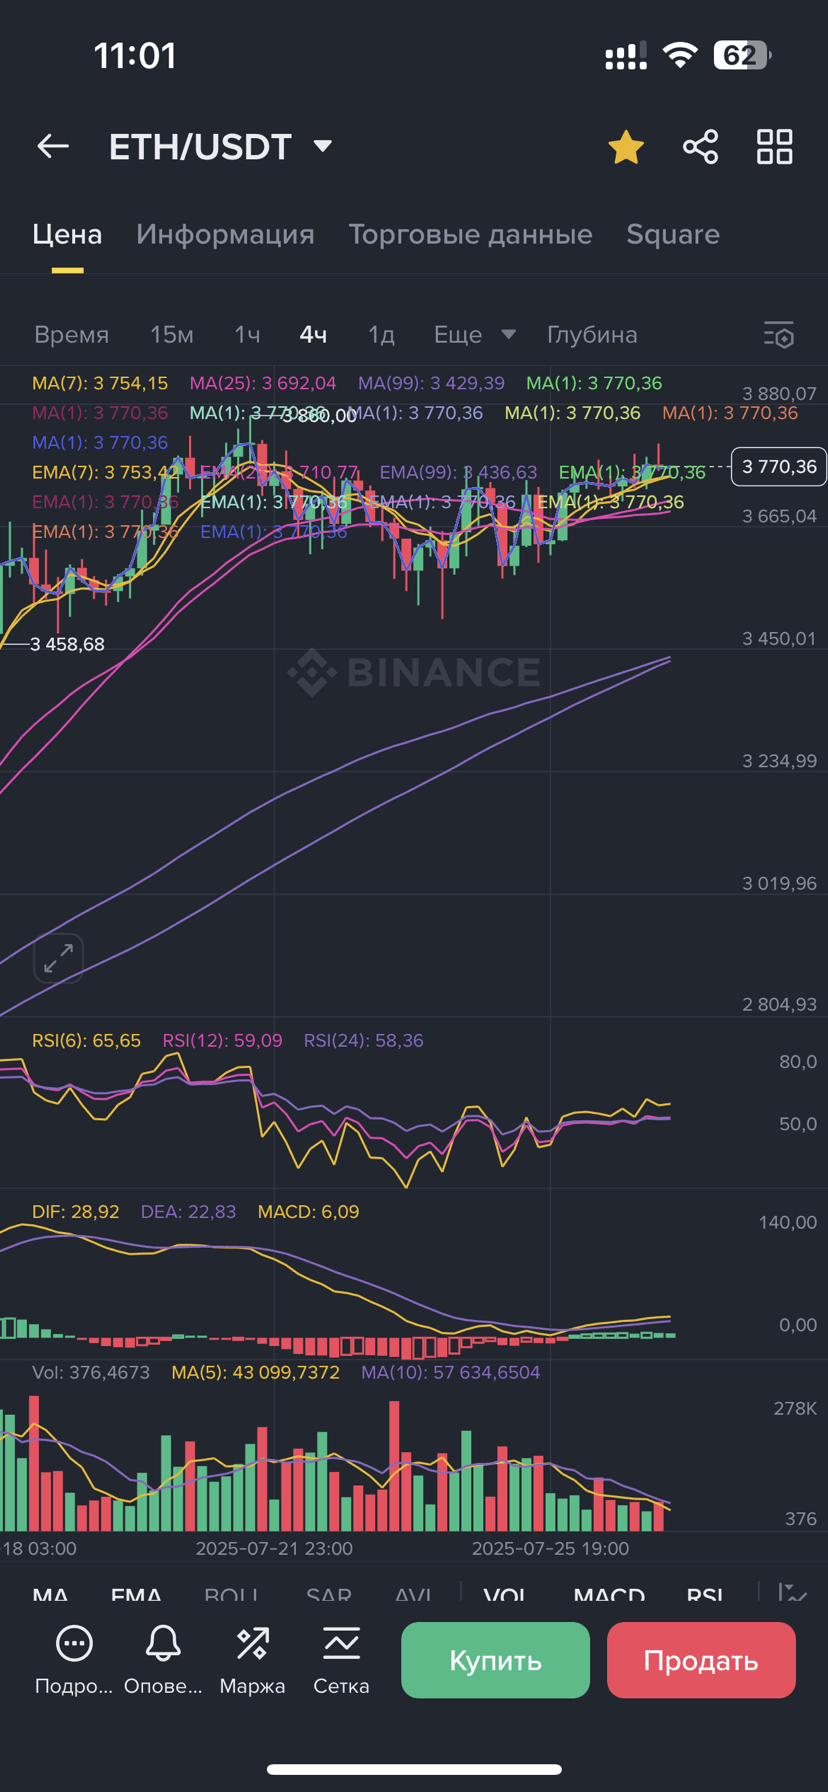
On 4H — flat movement in the range $3,665–3,860, volumes are decreasing, MACD is slightly turning upwards.
Price is hovering under the local maximum $3,860 (strong resistance).
Fibonacci construction (by impulse)
Taking the last upward movement:
Low (start of impulse): ~$2,112
Top (maximum): ~$3,860
Growth range: $3,860 − $2,112 = $1,748
Key Fibonacci levels (expansion and retracement):
Extension levels (if it breaks $3,860):
1.0 (already reached): $3,860
1.272 → $4,090
1.414 → $4,180
1.618 → $4,330
2.0 → $4,610
Retracement levels (if correction):
0.236 → $3,450 (support in sideways movement)
0.382 → $3,180
0.5 → $2,986
0.618 → $2,793
Scenarios with time calculation
Scenario 1: Breakout upwards
If ETH breaks $3,860 with volume:
Level $4,090 (1.272) — achievable in 2–3 days
Level $4,180 (1.414) — in 4–5 days
Level $4,330 (1.618) — within 7–10 days
Level $4,610 (2.0) — possibly in 2–3 weeks, if the market retains momentum
Condition: BTC does not fall, but stays above $117,000.
Scenario 2: Correction and accumulation
If it doesn't break $3,860 and goes into retracement:
Support ~$3,450 (0.236) — likely within 1–2 days
If pushed down — test $3,180 (0.382) — in 3–5 days
Below $3,000 is unlikely, only if BTC crashes
Currently accumulating below resistance $3,860.
If it holds above — Fibonacci targets $4,090 → $4,180 → $4,330
Strong correction possible only if it fails below $3,450.