'The market is like a roller coaster, and people who don't fasten their seat belts will be thrown off sooner or later!' Today's ETH (1-hour chart) is like a player who has just finished a half marathon - looking breathless but still wanting to sprint, but their legs have already started to tremble. When we break down the signals, we must not only see the bull's 'stubbornness', but also keep a close eye on the hidden dangers of its 'physical exhaustion'.
Core Signal Breakdown: Bulls have strength, but 'bloated' is obvious
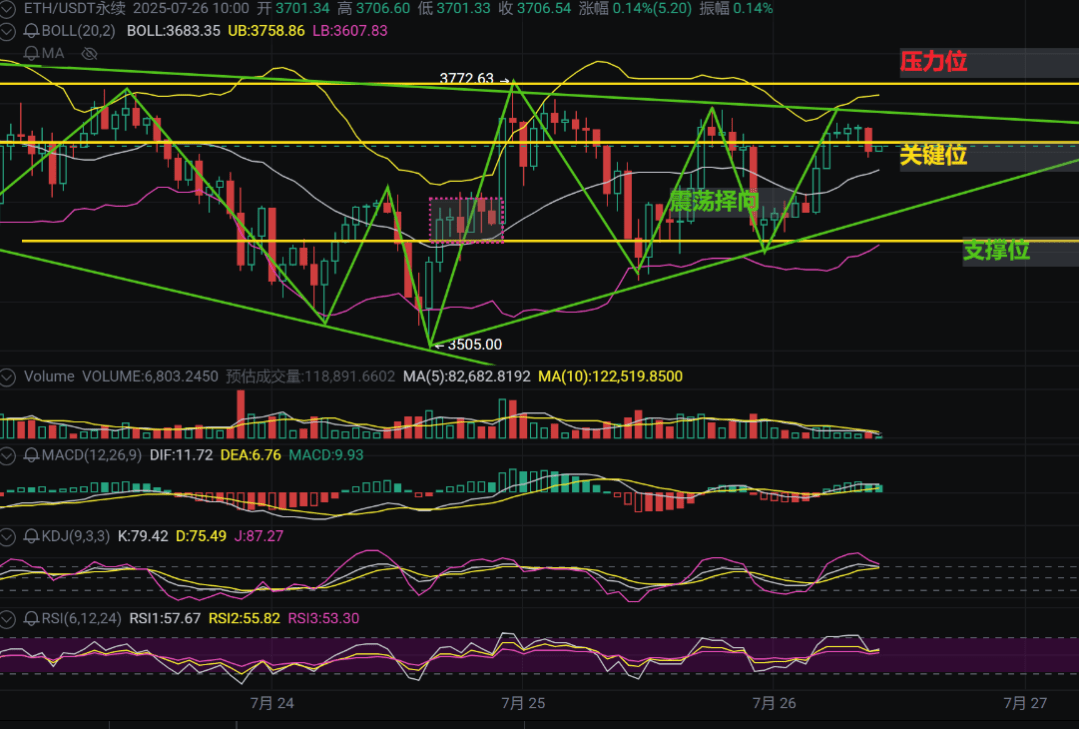
Price Position: Standing on the Bollinger Band middle track (3683), like standing on a step to reach for an apple high up.
The current price of 3706 is only $50 away from the upper track of 3758, and more importantly, the user-marked strong resistance level of 3772 (even higher than the upper track). This is like climbing stairs - the middle track is the first floor, the upper track is the second floor, and 3772 is the top floor terrace. Now the bulls have just stabilized on the first floor, and they want to rush to the terrace?Someone has to push from behind (increased volume), otherwise you can't reach it by yourself, and you can easily fall down.
Case:On July 18, ETH also rushed to a similar position (around 3760), but as a result of insufficient volume, it fell directly from the 'terrace' back to the middle track (3680), with a drop of over 2%.MACD: Bull's 'adrenaline' surges, but don't forget to look at the 'medical examination report'
The MACD histogram (9.93) and DIF (11.72) are soaring, like bulls who have been injected with stimulants. ButThe trading volume (6803) is less than a fraction of the 5-day average volume (82682)- This is like someone saying 'I can lift 100 kg', but they can barely lift a 20 kg dumbbell.Without real money buying, the rise is 'bloated'.
Personal opinion:Historically, every time ETH's MACD 'soars' but the volume is insufficient, there is an 80% probability of a high pullback. For example, on June 25, the MACD red column rose for 3 days, but as a result of volume shrinkage, it plummeted by 8%.KDJ/RSI: The bulls have a 'fever', but haven't burned to the point of unconsciousness
The J value of KDJ (87.27) has already rushed into the 'high fever zone' (overbought), like a person's heart rate soaring to 180 when running a marathon, and they may cramp at any time. But RSI (57.67) is still in the 'mild zone' of 50-60, indicating that the market hasn't completely 'gone crazy' -The bulls still have strength, but need to rest.
Analogy:This is like staying up late to play games. At 2:00 AM, your eyes are almost unable to open (KDJ overbought), but your hands can barely operate (RSI neutral), but if you stay up for another half hour, you will fall asleep directly on the table (retracement).
Today's Key Scenario: 'High-altitude tightrope walking' between 3680-3770
High Surge Scenario (40% probability): Bulls 'desperately' increase volume to break through 3772 (trading volume needs to exceed 1.2 times the 10-day average volume of 122519), like on March 14, 2023, directly pulling out a 5% large positive line. However, this 'violent breakthrough' requires Bitcoin's cooperation, otherwise it will be difficult to sustain alone.
Oscillation Scenario (50% probability): The price fluctuates back and forth between 3680-3770, like two people playing tug-of-war - the bulls pull up, the bears pull down, and in the end no one wins, resulting in a small doji star.
Plummet Scenario (10% probability): If it falls below the middle track of 3680 (especially if the 1-hour closing price is lower than this), like on May 19, 2023, it will directly plummet back to the 3505 support level, with a drop of over 4%.
Shen Ce's 'Survival Guide'
Don't be a 'bagholder': The area around 3770 is a 'high-voltage area', don't touch it without increased volume! If you really want to chase the rise, wait for the price to stabilize at 3772 and the trading volume to increase (for example, the 1-hour trading volume exceeds 150,000).
The 'floor price' is the lifeblood: The middle track of 3680 is a short-term 'lifeline', run away if it breaks (especially if the 1-hour K-line closing price is lower than this), don't wait for a rebound.
Beware of 'false fire': No matter how good the MACD looks, if the volume doesn't keep up, it's just a 'paper tiger'. If the price rushes to around 3750 but the volume shrinks (for example, the 1-hour trading volume is less than 50,000), directly short, with a stop loss at 3775.
'Bargain hunting' opportunity: If it pulls back to around 3680 and the MACD green column shortens (bullish counterattack signal), you can try long with a small position, with a stop loss at 3650.
Today's ETH is like a 'high-altitude acrobatics' - the bulls are dancing on a tightrope, and below is the 'safety net' of 3680. If they jump well, they can rush to the terrace of 3770, if they don't jump well, they will fall directly. Do you want to be an audience member, or do you want to be the director who yells 'stop' at a critical moment? Follow me, let's analyze the market while watching the market, and teach you how to seize 'breakthrough points' step by step!#以太坊交易量反超比特币