The 15-minute chart of $MDT
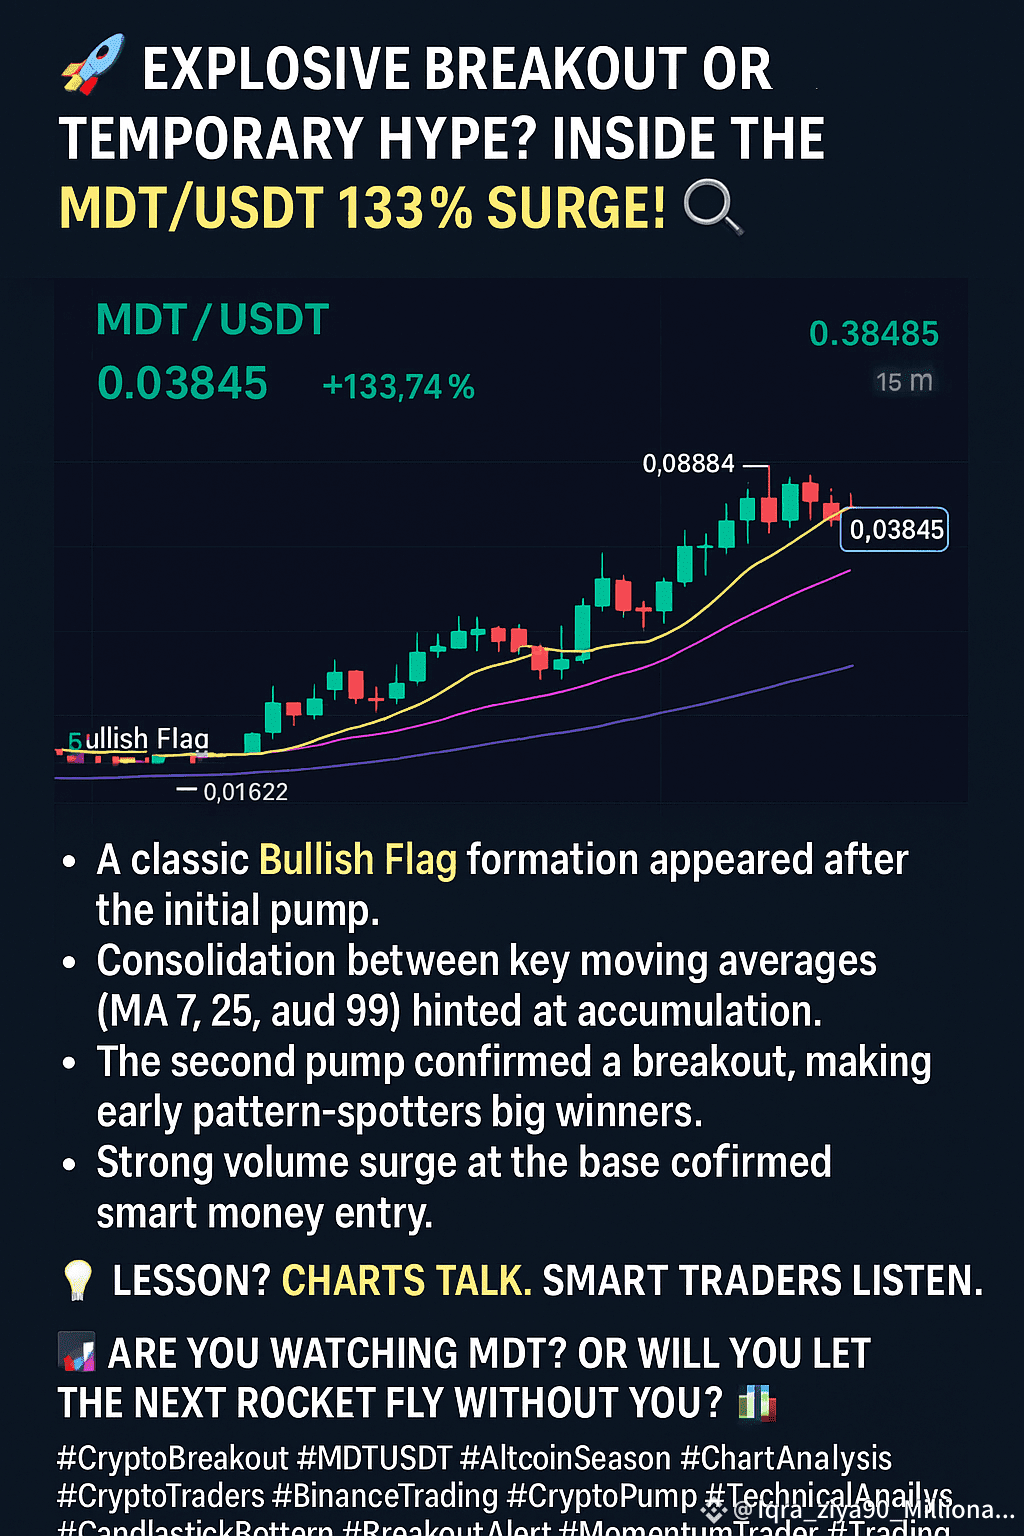
MDT/USDT just told an electrifying story — and smart traders were listening.
From a jaw-dropping low of $0.01622 to a fiery peak of $0.04884, $MDT exploded with a +133% gain in a matter of hours. But the real magic? It wasn’t random — the chart was screaming signals.
📈 What made this chart so special?
Consolidation between key moving averages (MA 7, 25, and 99) hinted at accumulation.
The second pump confirmed a breakout, making early pattern-spotters big winners.
Strong volume surge at the base confirmed smart money entry.
🔮 Currently, price is hovering around $0.03845, cooling down after the rally. The candles are pressing against the 25-MA line, showing a potential for either breakout continuation or reversal — and that’s what makes it exciting.
💡 Lesson? Charts talk. Smart traders listen.
The $MDT /USDT 15-minute chart was a masterclass in pattern-based trading. This wasn’t just a fluke; it was a lesson in momentum, timing, and volume confirmation. If you caught it, congrats. If you missed it — next time, trust the pattern.
📊 Are you watching MDT? Or will you let the next rocket fly without you?
#crypto #Megadrop #altcoinseason #TradingCommunity #Binance