Interpreting candlesticks in the crypto market (or any other financial market) is an essential skill in technical analysis. Each candlestick provides information about price movement over a given period. Here’s how to read and interpret them effectively:
---
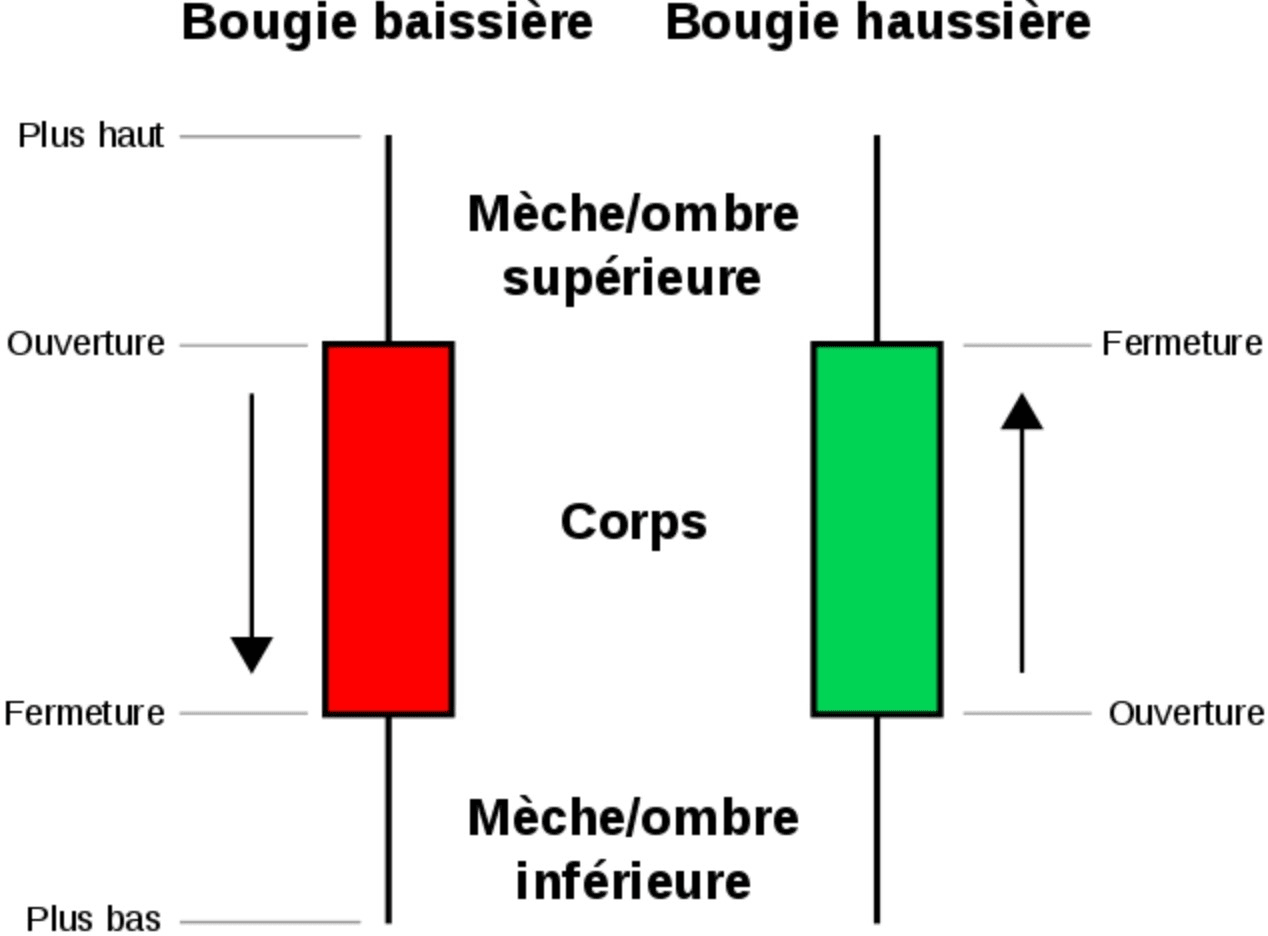
📌 1. Structure of a candle
Each candle represents 4 key pieces of information over a given period (1 min, 1h, 4h, 1d, etc.):
Open: the opening price
Close: the closing price
High: the highest price reached
Low: the lowest price reached
Example:
High
│
│
┌──┴──┐ ← Body (between Open and Close)
│ │
└──┬──┘
│
Low
Green candle: close > open (uptrend)
Red candle: close < open (downtrend)
Ù---
📊 2. Interpretation of candle shapes
Some individual candles provide powerful signals:
Candle shape Meaning
Marubozu Candle without a wick (strong buying or selling pressure)
Doji Open ≈ Close → market indecision
Hammer Rejection of a support → bullish signal
Shooting star Rejection of a resistance → bearish signal
Engulfing Candle that engulfs another → possible reversal
---
🧠 3. Context = key
One candle alone is never enough. Always consider:
The technical level: support / resistance?
The current trend: bullish, bearish, neutral?
Volume: a candle with high volume = stronger signal
The patterns of multiple candles (e.g., 'morning star', 'evening star', 'three soldiers', etc.)
---
🔍 4. Examples of patterns to know
Pattern name Number of candles Signal
Bullish Engulfing 2 Bullish
Bearish Engulfing 2 Bearish
Morning Star 3 Bullish
Evening Star 3 Bearish
Three White Soldiers 3 Strongly bullish
Three Black Crows 3 Strongly bearish
---
📈 5. Tip for trading candles
Watch key levels (e.g., previous highs/lows, supports/resistances)
Wait for confirmation (e.g., wait for a closing candle)
Combine with other tools: RSI, MACD, volumes, Fibonacci…
-