Review of yesterday's market
Reviewing yesterday's BTC price movement, it quickly rebounded after multiple dips near the support level of 117300. This morning, after another dip, it surged upward, reaching a high of around 119300.
Yesterday we analyzed that after a big rise, a correction and repair trend would likely follow. At that time, the 1-hour K-line chart showed a bearish signal after five consecutive positive candles. Based on this, we decisively placed short positions near 119100, and subsequently, BTC dropped to a low of around 117600, perfectly capturing a profit of 1500 points.
In addition, we discovered through intraday analysis that BTC rebounded multiple times at the support level near 117300, and there were five consecutive bearish candles on the 1-hour chart. After a dip, we decisively placed long positions near 117300. Subsequently, BTC rose all the way up, reaching a high of above 118800, where the bulls secured profits and captured another 1500 points. Yesterday's market saw a drop followed by a rise, and we successfully grasped the rhythm of long and short positions, achieving a profit of 3000 points.
Today's market analysis
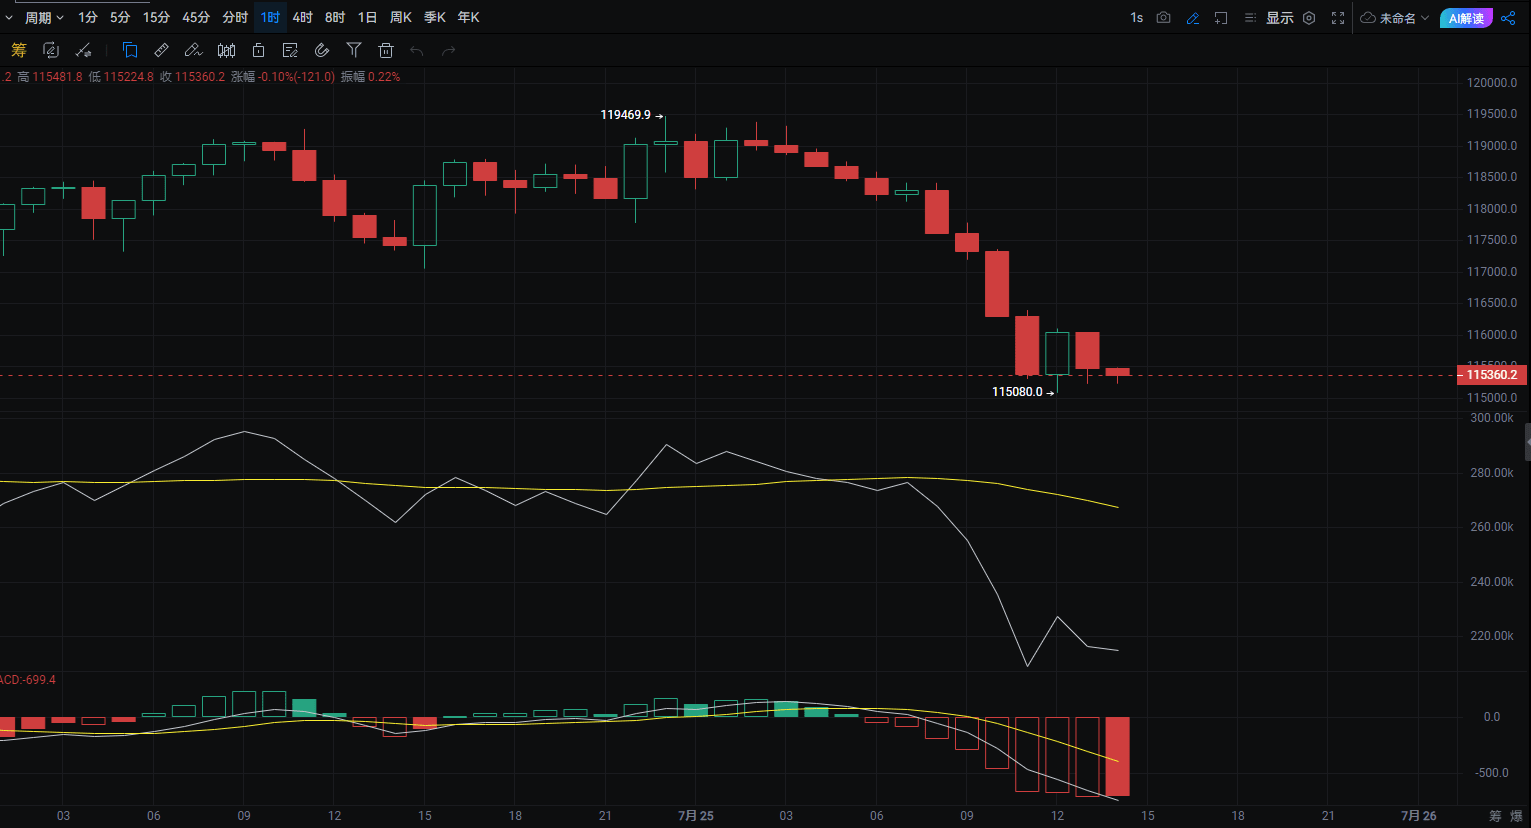
This morning, BTC once again approached the trend resistance level near 119500, and we placed short positions near 119000. Currently, BTC has fallen to a low of 117000, securing a stable profit of 2000 points on the short position.
From the trend chart, we continue to focus on the trend resistance level near 119800 for intraday operations. If BTC rebounds to the range of 119300 - 119000, we can open a short position; if it breaks through this range, we will look towards the integer level of 120000, and consider shorting again at that position. On the downside, we should focus on the previous low support level near 116000 in the short term. When BTC retraces to the range of 115800 - 116000, as long as it does not break down, we can go long; once it breaks, we will look for long opportunities near 115000.
From a technical analysis perspective:
Daily level: The Bollinger Bands are narrowing, and yesterday closed as anticipated with a bearish candle. This morning, after BTC broke below the moving average crossover at 118300, it fell all the way down, with a drop of 2500 points. Intra-day, we should focus on whether the mid-band support near 116300 breaks; if it breaks, we expect it to continue to dip. It is advised to primarily short at high rebounds.
12-hour level: The Bollinger Bands are narrowing, and two bearish candles with a cross have appeared above, indicating a clear bearish trend. After breaking the mid-band and the MA10 crossover support in the morning, it is still falling. If the Bollinger Bands widen intra-day, we expect BTC to have another drop space; short-term focus is on the support at 116000, with a long-term target aimed at 113000.
Technical indicators: In the MACD indicator, both DIF and DEA are below the zero axis, and DIF is below DEA, with a negative histogram, indicating a bearish trend; in the KDJ indicator, the J value once dropped below 20 entering the oversold region, although there has been a rebound, the K and D lines do not cross frequently and are both below 50, indicating weakened momentum. There is a demand for a rebound, but upward momentum is insufficient; in terms of the EMA indicator, EMA (7) has fallen below EMA (30), and both are in a downward trend.
In summary, after falling in the morning, BTC has a certain upward trend in the short term, but the space is limited, and the overall trend trading still primarily focuses on shorting at high rebounds.
Today's operational strategy
Short in the range of 119300 - 119000, targeting 117500 - 116000, with a stop loss set at 119800.
Long in the range of 115800 - 116000, targeting 117500 - 118500, with a stop loss set at 115300.
For those who cannot grasp the market, you can follow @Analyst A, keep the rhythm, and welcome the bull market together!!!

