Introduction:
In the cryptocurrency market, every fluctuation of Bitcoin pulls at the hearts of countless investors. From April 8 to now, Bitcoin's trend has been like a dramatic rollercoaster, capturing the attention of global investors. So, in this feast, what secrets does Bitcoin's bull market cycle hide? When is the best time to enter and exit? Let’s unveil the 'heartbeat' code of Bitcoin together.
1. The three phases of Bitcoin: From recovery to euphoria
Since April 8, Bitcoin's rise can be divided into three distinct phases:
Phase one: Recovery rise (April 8 - May 22)
Increase: From a low of 74620 to a high of 111980, an increase of nearly 50%.
Background: The rise in this phase primarily addresses the drop after the tariff war, with market sentiment gradually recovering from its low state, and bears suffering heavy losses.
Phase two: Pullback accumulation (May 23 - June 22)
Decline: From a high of 11980 to 98200, a decline of about 12%.
Background: After a significant rise, the market experiences profit-taking, and the price pullback is a buildup for the next wave of rise.
Phase three: FOMO emotion dominates (June 22 to present)
Increase: From 98200 to a maximum of 123218, an increase of about 25%.
Background: The FOMO emotion brought by the listing of CRCL, as well as the passage of stablecoin legislation, injects new vitality into the market. The frenzied purchases of stock tokenization and ETFs make the linkage between coins and stocks the main theme of this phase.
Key point: The rise in phase three is not solely dominated by Bitcoin but is jointly driven by market sentiment and external factors. The main force in this phase of the rise is those public chains related to the stablecoin concept, such as ETH and XRP.
2. Technical indicators analysis: Bullish trend unchanged, but caution is needed for pullbacks
1. Daily level MACD top divergence
Conclusion: Every rise of Bitcoin ends with daily level MACD top divergence. Currently, this phenomenon has not occurred, so Bitcoin may still break new highs.
Risk: However, the final rising phase often involves difficulty in participation, poor holding experience, and excessive participation may hinder the shift in bullish and bearish thinking.
2. Indicators at all levels are healthy
Weekly and 3-day levels: MACD and RSI are both healthy and have not entered the overbought zone.
Daily level: MACD divergence, RSI slightly overbought, currently undergoing a strong recovery.
12-hour level: Indicators are in recovery.
Operational suggestions:
Large position: Take profits in batches and refrain from operating, waiting for the next clear signal.
Flexible position: Buy at the bottom of the sideways range, setting a stop-loss at the lower edge.
3. Ethereum's 'copy and paste' path: Can it break through $4000?
1. Historical performance of Ethereum
Range performance: Ethereum has performed excellently in the $2000-$3000 and $3000-$4000 ranges, which have been mentioned for nearly a year.
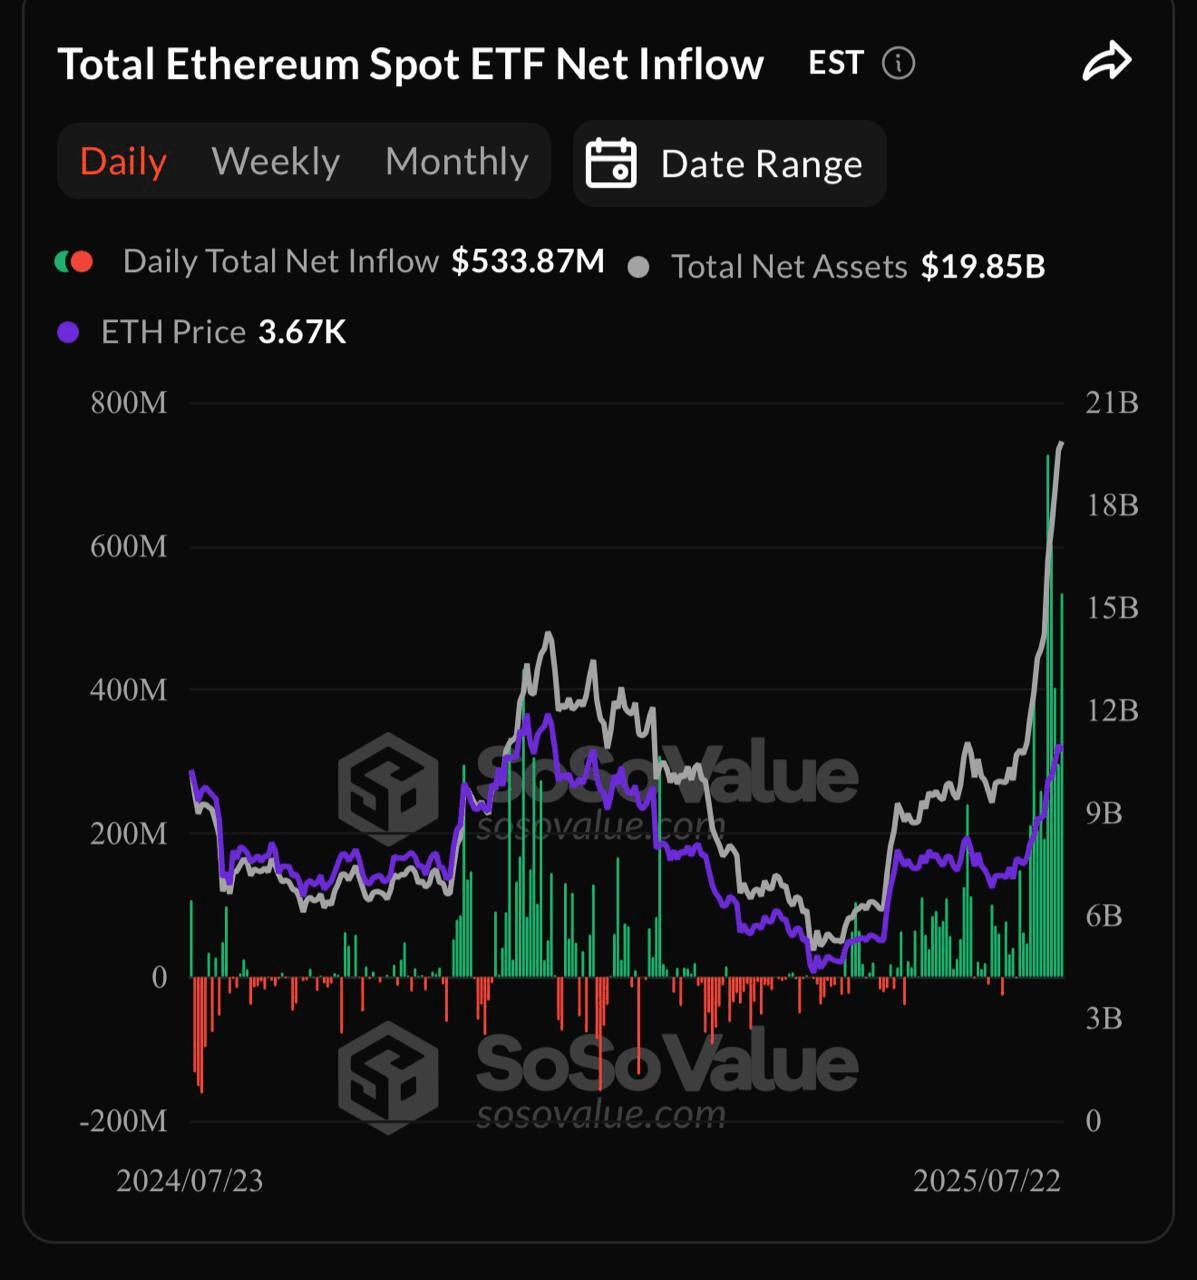
Current target: In this round of upward movement, Ethereum is expected to touch $4000, but there are doubts about directly breaking through to $4500.
2. Technical analysis
Second upward phase: The second upward phase of Ethereum has already surpassed the first phase by more than double, currently retesting the one-time position without breaking.
Key support: $3300 is the key support level to maintain the bullish structure.
Operational suggestions:
Short-term target: If Ethereum can break through $3800, it is expected to surge to $4100 or even $4300.
Long-term perspective: Focus on improvements in Ethereum's fundamentals, such as performance expansion, and whether expectations can be realized.
4. Secrets of the bull market cycle: Capital flow and market sentiment
1. Four phases of the bull market cycle
Phase one: Fiat currency → Bitcoin, new funds flow into the crypto market through Bitcoin.
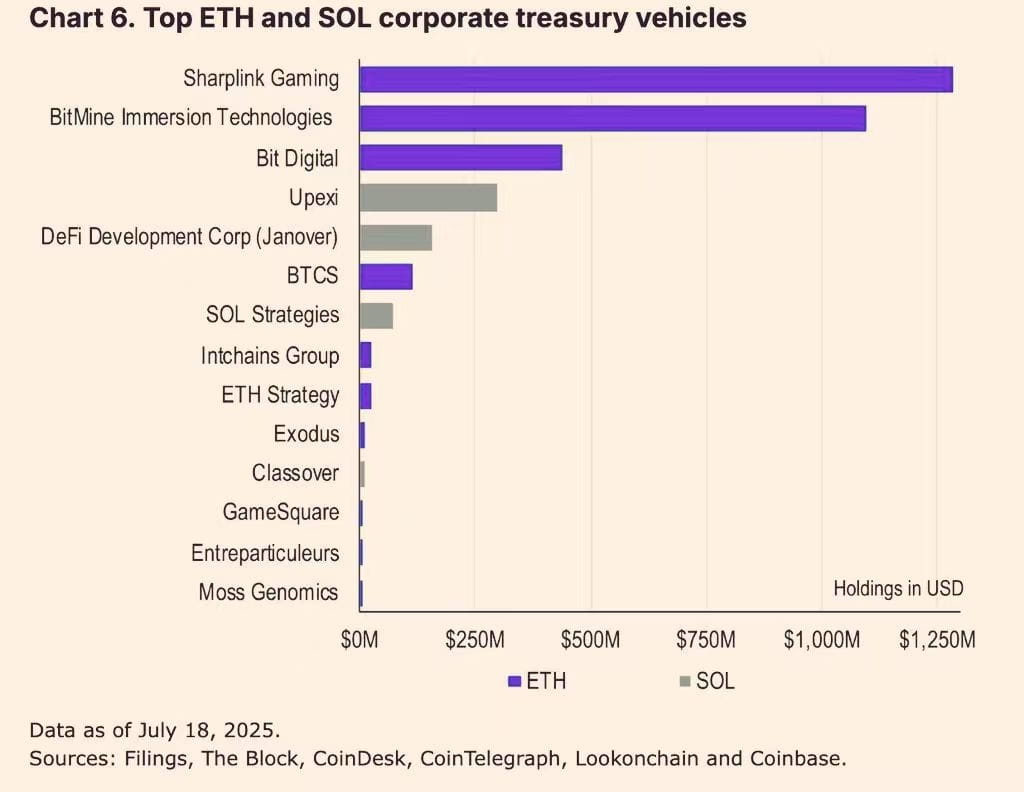
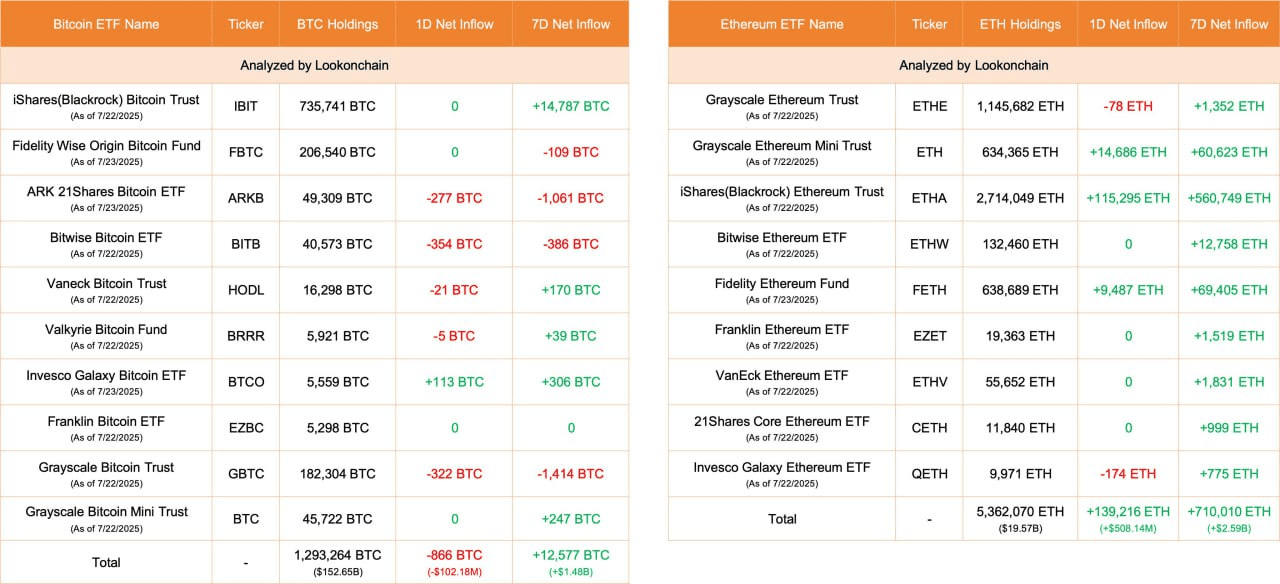
Phase two: Bitcoin → Large altcoins, investors turn to large altcoins like ETH and SOL in pursuit of higher profits.
Phase three: Large altcoins → Medium-cap and popular speculative tokens, market volatility intensifies, and greed and FOMO psychology emerge.
Phase four: Meme coin frenzy, marking the peak of the bull market cycle.
2. Current market situation
Market cap breakthrough: The total cryptocurrency market cap is expected to exceed $4.15 trillion, with the altcoin market cap target reaching $1.8 trillion.
Meme coins and RWA: Unlike in the past, in this cycle, Real World Assets (RWA) may become a new narrative hotspot, leading the market into a new frenzy cycle.
5. Conclusion: Grasp the cycle, invest rationally
Bitcoin's bull market cycle is like a carefully choreographed drama, with each phase having its unique plot and characters. As investors, we need to do more than just dance to the market's rhythm; we must remain rational amidst the frenzy and see opportunities during pullbacks.
Remember:
Focus on capital flow: Identify trends and signs of euphoria to avoid blindly chasing highs at market tops.
Develop a profit-taking plan: Decisively lock in profits when the market reaches expected targets to avoid the dual squeeze of greed and fear.
Continue learning and reviewing: Every investment is a learning opportunity; continuously optimize your trading system through reviews to enhance your investment skills.
In this feast of cryptocurrency, may we all become the wise ones who laugh last.
(This content is for reference only and does not constitute investment advice. Investment carries risks; proceed with caution.)