After a relatively calm adjustment period, the market recovery may come faster than expected.
In recent weeks, the price of Ripple (XRP) has surged from below $2.50 to nearly $3.60, causing a stir in the cryptocurrency market. This performance stands in stark contrast to Ethereum's relatively weak price action and raises the question: Could Ripple become a stronger competitor in the market?
The daily chart shows that XRP has experienced a strong momentum-driven breakout, pushing its price well above its 50, 100, and 200-day moving averages. The price trend is solid, and although the RSI has entered the overbought territory, there are hardly any signs of panic selling; the RSI is currently hovering above 80. This indicates that the rebound is supported by sustained confidence, and importantly, there is little resistance, contrasting sharply with Ethereum's breakout, which often faced strong selling pressure from institutional rotations and holders.
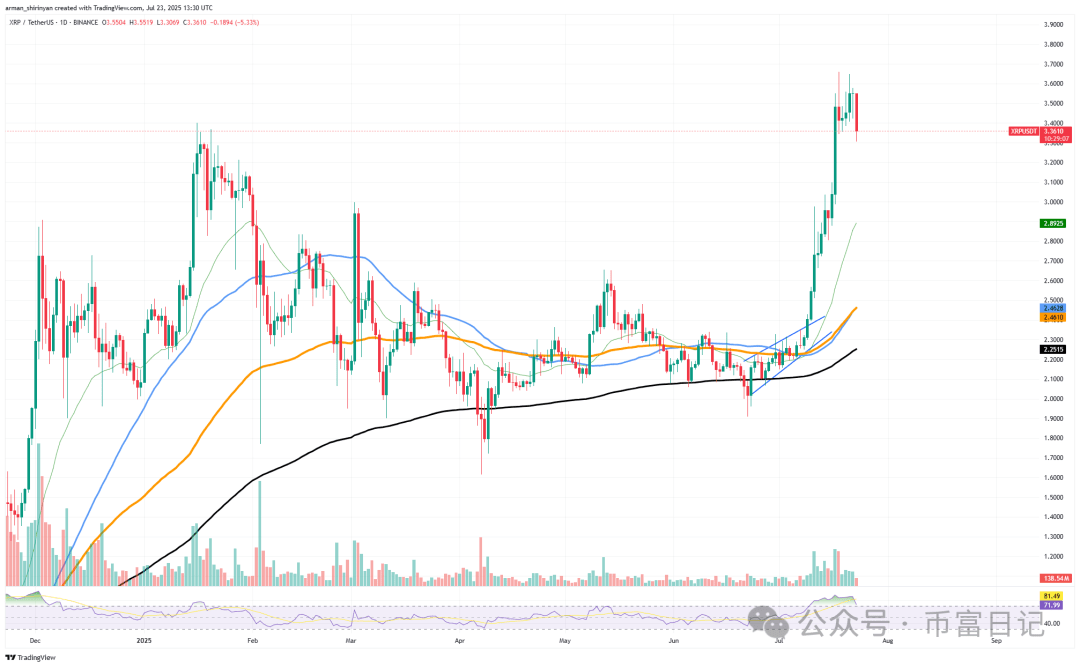
It is noteworthy that XRP faces less selling pressure. Compared to Ethereum, XRP's breakout seems to be driven more by spot accumulation rather than leveraged speculation. Ethereum often experiences inflows and significant sell-offs during major volatility.
Therefore, the foundation for its upward trajectory is more solid. However, this strength also comes at a cost. Ethereum has a purchasing power advantage, as its price surges are often driven by high trading volumes and large liquidity pools. Although Ripple's relative strength is impressive, it still faces the issue of low trading volume, and its sustainability will be called into question without new capital entering the market.
When momentum diminishes, XRP may experience a sudden pullback in the absence of further participation. In terms of structure and speed, XRP's current performance clearly surpasses Ethereum's. If this divergence continues, especially while Ethereum remains below important resistance levels, XRP is likely to become a more powerful force—at least in the short term of this cycle.
Bitcoin is not far off.
Bitcoin's price suggests it is on the verge of reaching the $150,000 milestone. Bitcoin remains robust, holding above important moving averages; although there has been short-term volatility after consolidating below $120,000, there are no signs of a significant drop.
Bitcoin still maintains an upward structure on the daily chart, steadily rebounding near the 26-day and 50-day moving averages. The market seems to be in a healthy consolidation phase rather than preparing for a pullback based on the current price action; the current pullback is characterized by slight retracements within a tightening flag.
A strong shock wave reached a peak of about $123,000 after breaking through the previous symmetrical triangle of around $107,000. Currently, there are no signs of structural weakness indicating that the trend has ended. Since the breakout, volume has decreased, but this is common during consolidation.
The Relative Strength Index (RSI) remains above 60, indicating that bullish momentum continues to dominate. As long as Bitcoin remains in the $120,000 range, this technical setup could serve as a springboard for its next parabolic move. Psychologically, $150,000 will be the next important breakout point.
Once volatility returns, Bitcoin may fluctuate rapidly, as there is no significant resistance between $120,000 and $135,000. Bitcoin's reputation as a technology-driven growth asset and macro hedge tool is further supported by its continued outperformance over traditional assets in momentum and capital flow indicators.
In short, the current chart structure not only supports the bullish argument but also accelerates its development. Unless a black swan event completely disrupts the macro market or the cryptocurrency market, Bitcoin's trajectory towards $150,000 seems to be a matter of time rather than possibility.
Is Shiba Inu ready?
Shiba Inu is approaching its 200-day moving average, a support level that may determine whether the current summer rally can continue or ultimately collapse. The SHIB price previously experienced explosive growth, briefly breaking through $0.000015, but is currently facing increasing selling pressure. As of the time of writing, the price has retraced to $0.0000144, directly touching the 200-day moving average, which has historically been an important resistance level and is now becoming a potential lifeline for bulls.
If successful in re-testing this level, it may trigger a new upward trend; if it fails, it could mean disaster. The combination of recent local highs and previous level resistance will further support this support area. The next downside target may be the $0.0000136 area, which is close to the 50-day moving average if SHIB's daily closing price falls below the 200-day moving average and breaks below the $0.000014 support level.
Falling below this level would allow entry into the $0.0000125 area, which is a node of dense trading volume and the location of the 100-day moving average. Momentum indicators are also issuing warnings. The RSI is currently on a downward trend, indicating that bullish momentum is weakening after retreating from overbought territory.
The recent increase in bullish candle volume indicates a growing confidence among sellers. This is not just another pullback for SHIB. After a significant breakout, re-testing the structural integrity is crucial.


