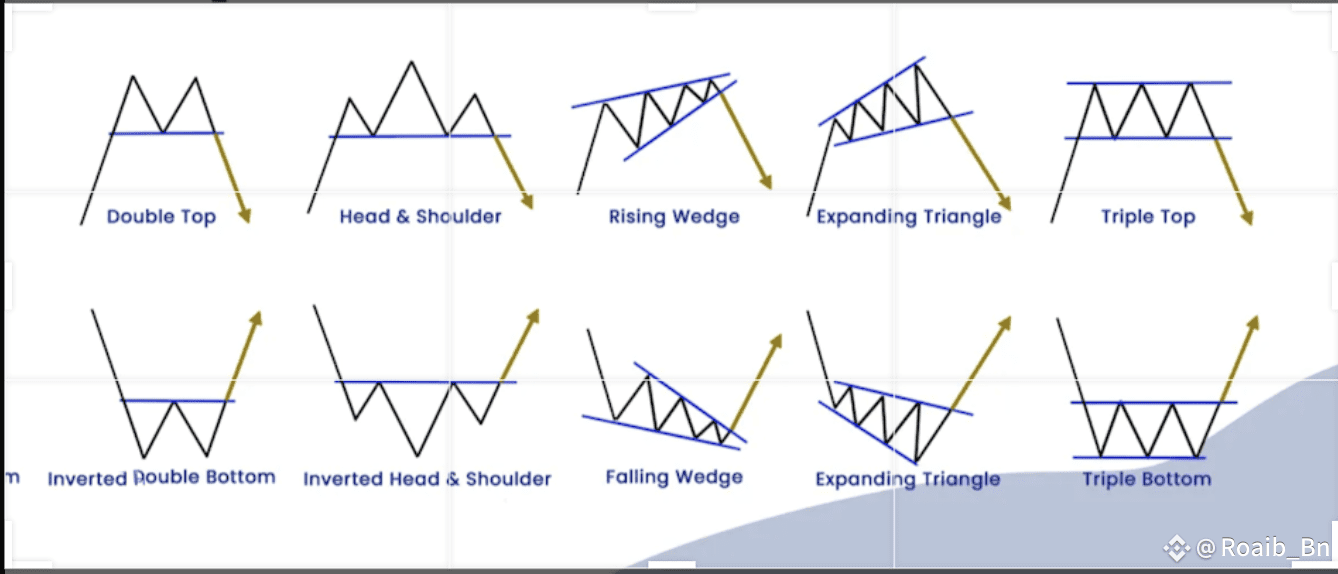
🔻 Bearish Patterns — Warning signs for a possible drop
📉 Double Top
Two peaks touch the same resistance.
Breakdown signals a trend reversal to the downside.
🧠 Head & Shoulders
Left shoulder, high head, right shoulder.
A neckline break confirms a strong bearish move.
🗻 Rising Wedge
Price climbs with higher highs/lows but narrows.
A breakdown suggests a bearish trend is coming.
🔺 Expanding Triangle (Bearish)
Wide price swings with higher highs and lower lows.
Breakdown shows heavy selling pressure.
🔳 Triple Top
Three peaks at the same resistance level.
Break below the neckline confirms bearish reversal.
---
🔺 Bullish Patterns — Get ready for lift-off
💎 Inverted Double Bottom
Price hits the same support twice.
Breakout above neckline = bullish trend begins.
👤 Inverted Head & Shoulders
Three dips: middle is deepest.
Once neckline breaks, bulls take over.
🌀 Falling Wedge
Lower highs and lows in a tightening squeeze.
Breakout upward shows buyers gaining strength.
🔻 Expanding Triangle (Bullish)
Wild price action widens, then breaks upward.
A strong bullish move follows.
🧱 Triple Bottom
Three equal lows form solid support.
Breakout above confirms bullish reversal.
---
💡 Pro Tip:
Pair these patterns with volume confirmation and support/resistance levels for higher accuracy!
HERE is the candles image 👇
If you find the post helpful then please follow like and comment on it thanks 👍
#TrumpBitcoinEmpire #BTCvsETH #StrategyBTCPurchase #ETHBreaks3700 #CryptoMarket4T