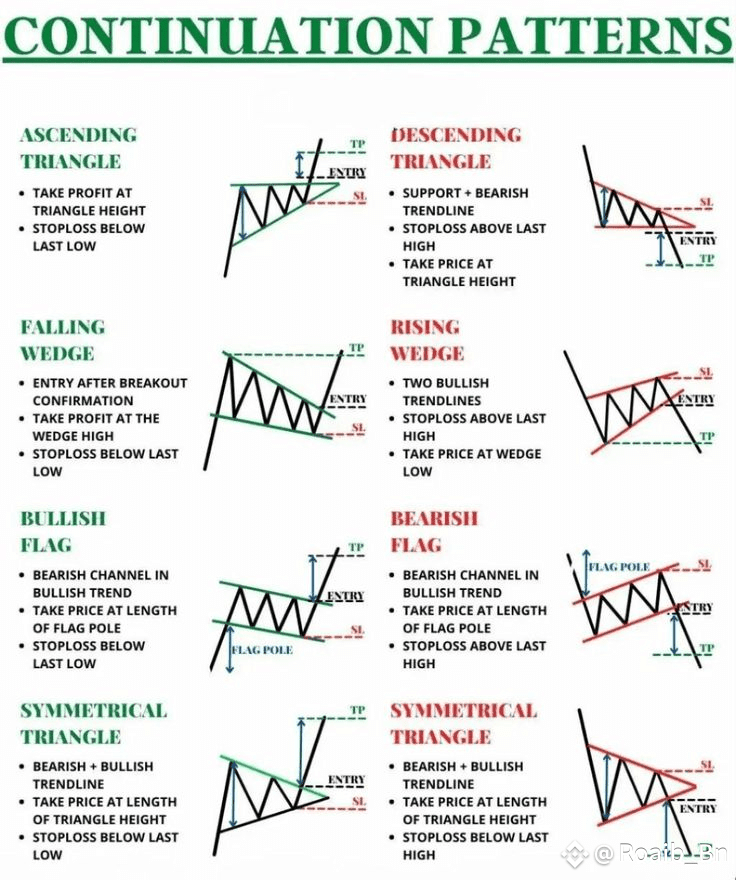
🔼 Ascending Triangle (Bullish)
A horizontal resistance meets rising support.
💰 Entry: Breakout above resistance
🎯 TP: Triangle height | 🛑 SL: Below last low
---
🔽 Descending Triangle (Bearish)
Flat support with falling highs signals bearish pressure.
💰 Entry: Break below support
🎯 TP: Triangle height | 🛑 SL: Above last high
---
📉 Falling Wedge (Bullish)
Downward converging trendlines; signals upcoming breakout.
💰 Entry: After breakout confirmation
🎯 TP: Wedge height | 🛑 SL: Below last low
---
📈 Rising Wedge (Bearish)
Two rising trendlines with weakening momentum.
💰 Entry: On breakdown
🎯 TP: Wedge height | 🛑 SL: Above last high
---
🚩 Bullish Flag
A downward channel after strong bullish impulse.
💰 Entry: Break above channel
🎯 TP: Flag pole length | 🛑 SL: Below last low
---
🚩 Bearish Flag
An upward channel in a downtrend pause.
💰 Entry: Break down from channel
🎯 TP: Flag pole length | 🛑 SL: Above last high
---
🔺 Symmetrical Triangle (Bullish)
Price compresses with higher lows and lower highs.
💰 Entry: Breakout upward
🎯 TP: Triangle height | 🛑 SL: Below last low
---
🔻 Symmetrical Triangle (Bearish)
Same pattern, but breakout is downward.
💰 Entry: Breakdown confirmation
🎯 TP: Triangle height | 🛑 SL: Above last high
HERE is the candles image 👇
IF you find the post helpful then please follow like and comment on it thanks 👍
#TrumpBitcoinEmpire #BTCvsETH #ETHBreaks3700 #StablecoinLaw #StrategyBTCPurchase