
When I was live streaming on Monday, someone asked A Leng what the upper rail of the Bollinger Bands is for? How to use it? But in fact, A Leng never looks at the upper rail when using Bollinger Bands. Instead, I use Bollinger Bands to judge whether a reversal will occur. Otherwise, let me write a text version to explain it.
Before delving deeper, I must first pour cold water on everyone: Bollinger Bands are not a panacea indicator. It's more like a drink or dessert when you eat, rather than a staple food. If we compare MACD, Fibonacci, and EMA moving averages to attack and defense in a game, then Bollinger Bands are like a dodge skill - useful, but can't be relied on alone.
1. The Basic Principles of Bollinger Bands
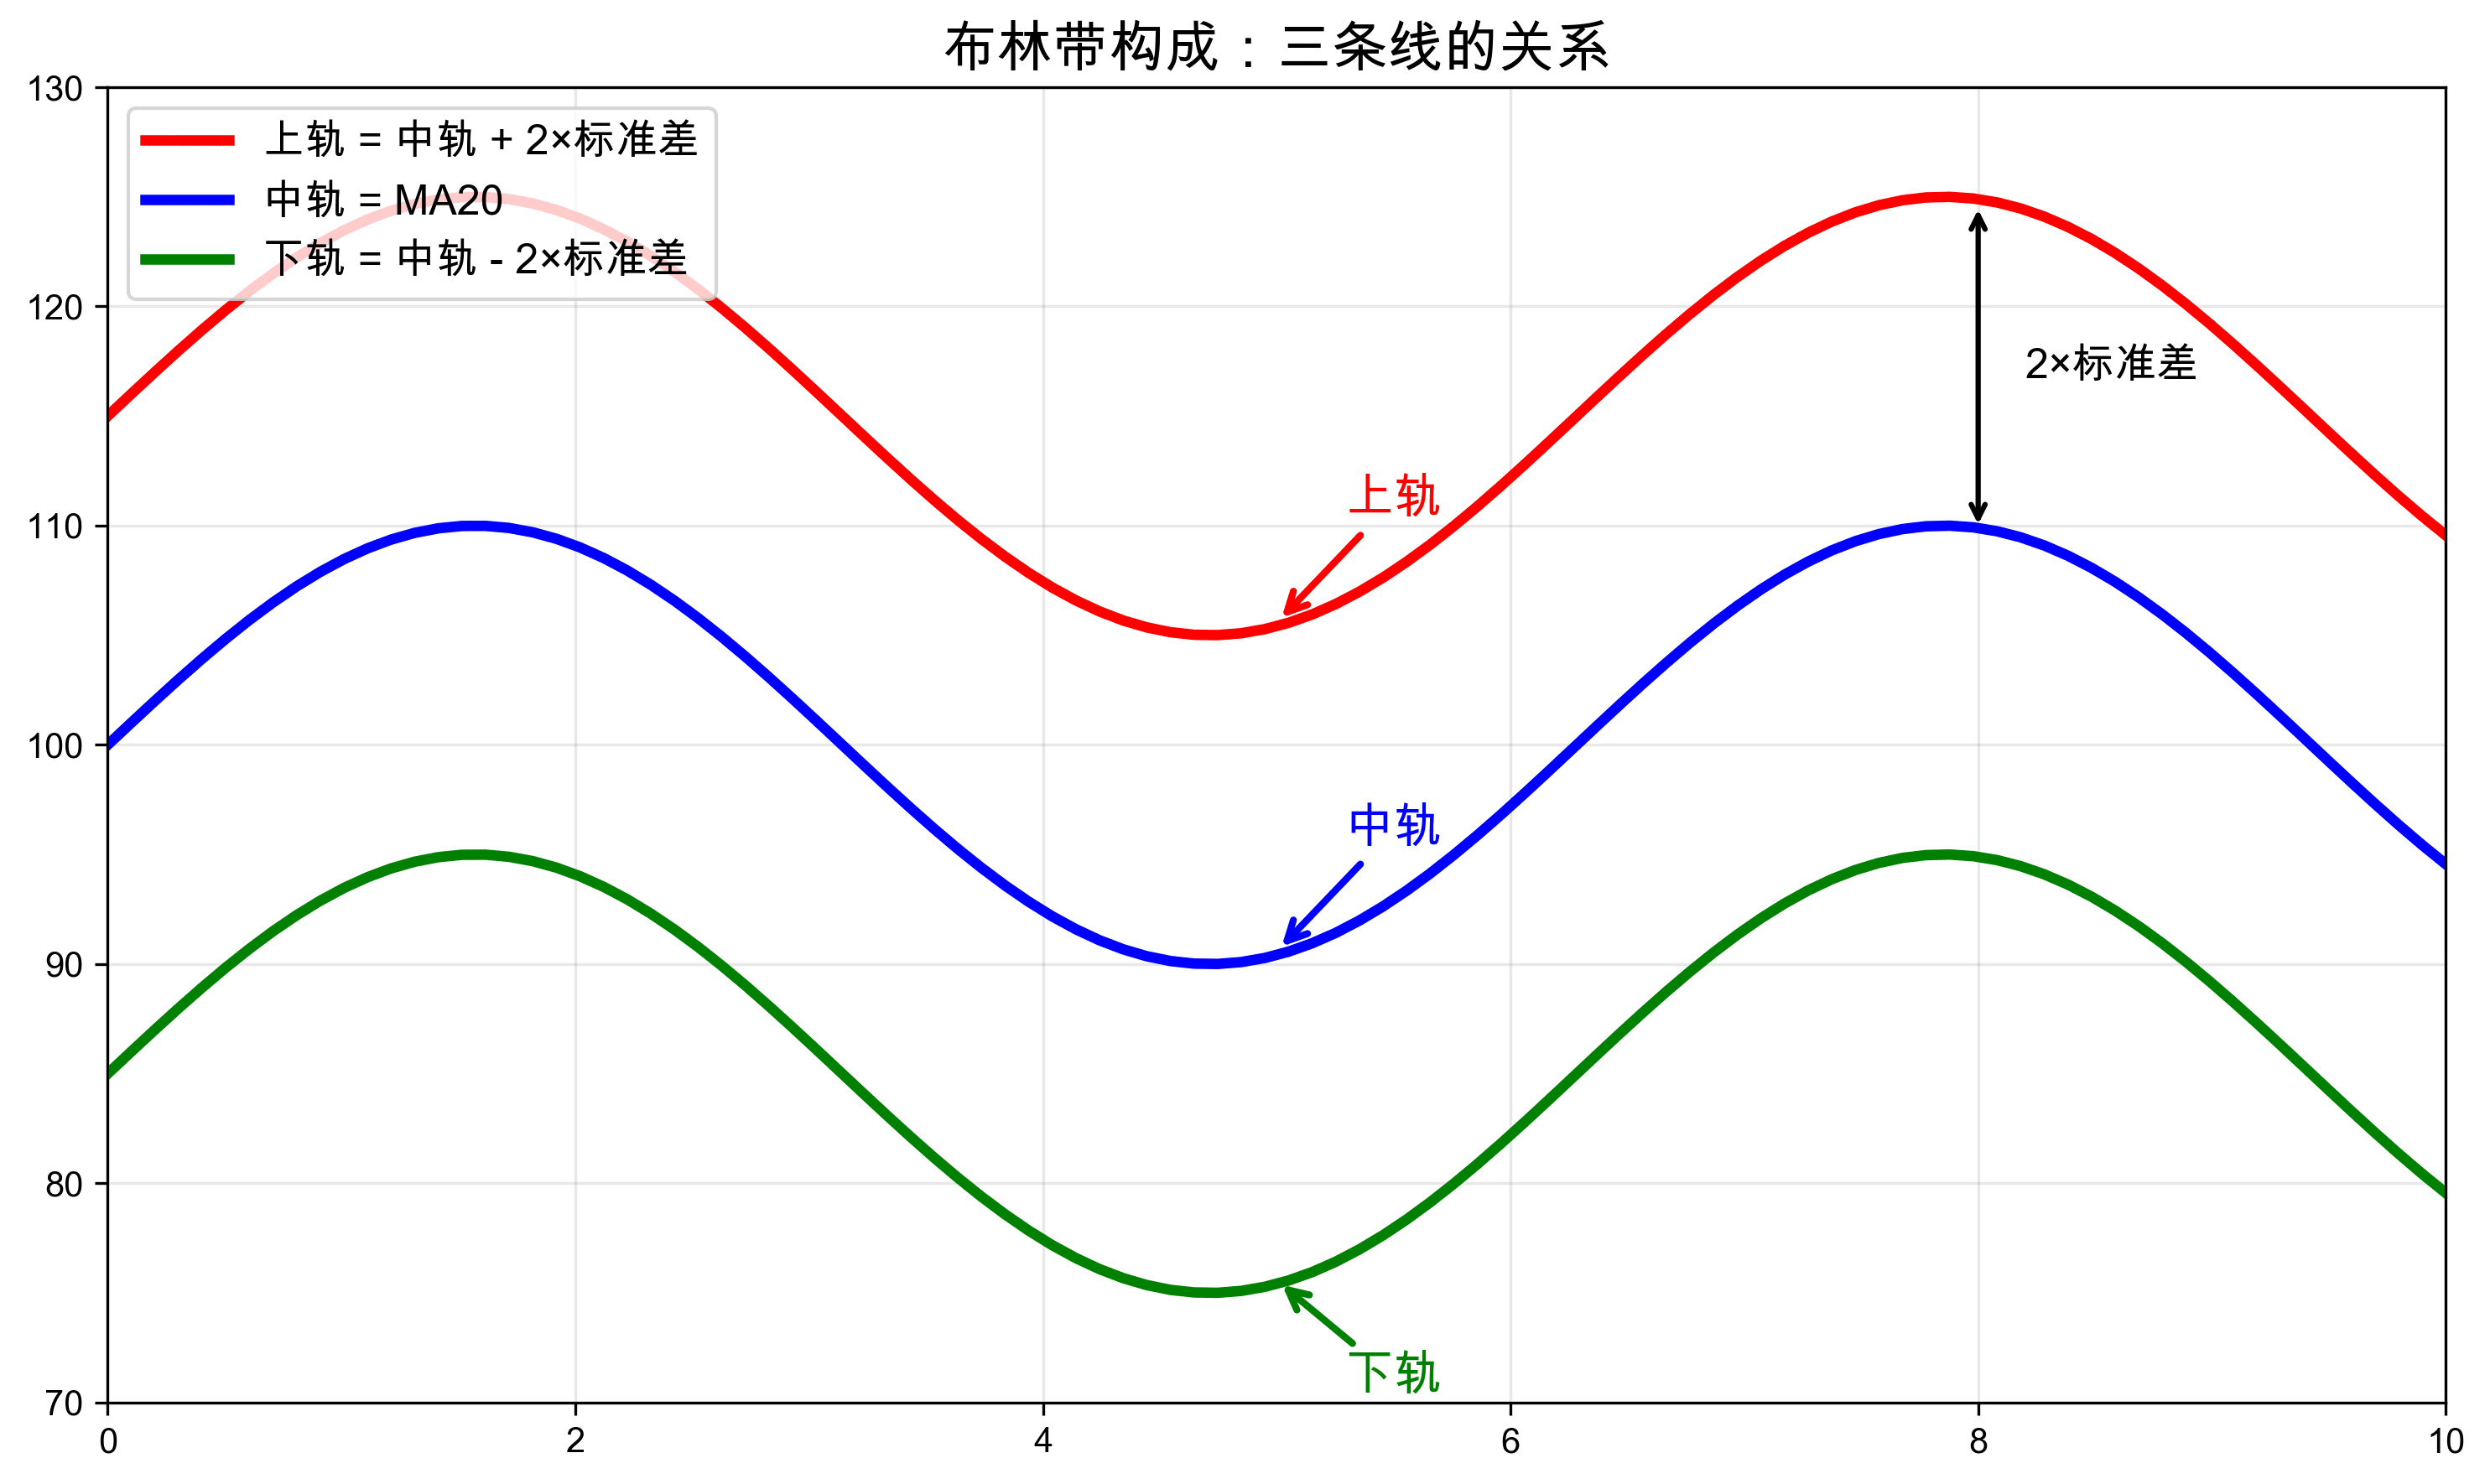
1.1 Composition of Bollinger Bands
Bollinger Bands consist of three lines:
Middle rail: 20-day moving average (MA20)
Upper rail: Middle rail + 2 times the standard deviation
Lower rail: Middle rail - 2 times the standard deviation
It's that simple! Don't be intimidated by the seemingly mysterious upper and lower rails. They are actually based on mathematical statistical principles. When the market fluctuates greatly, the standard deviation increases, and the Bollinger Bands widen. When the market is calm, the standard deviation decreases, and the Bollinger Bands narrow.
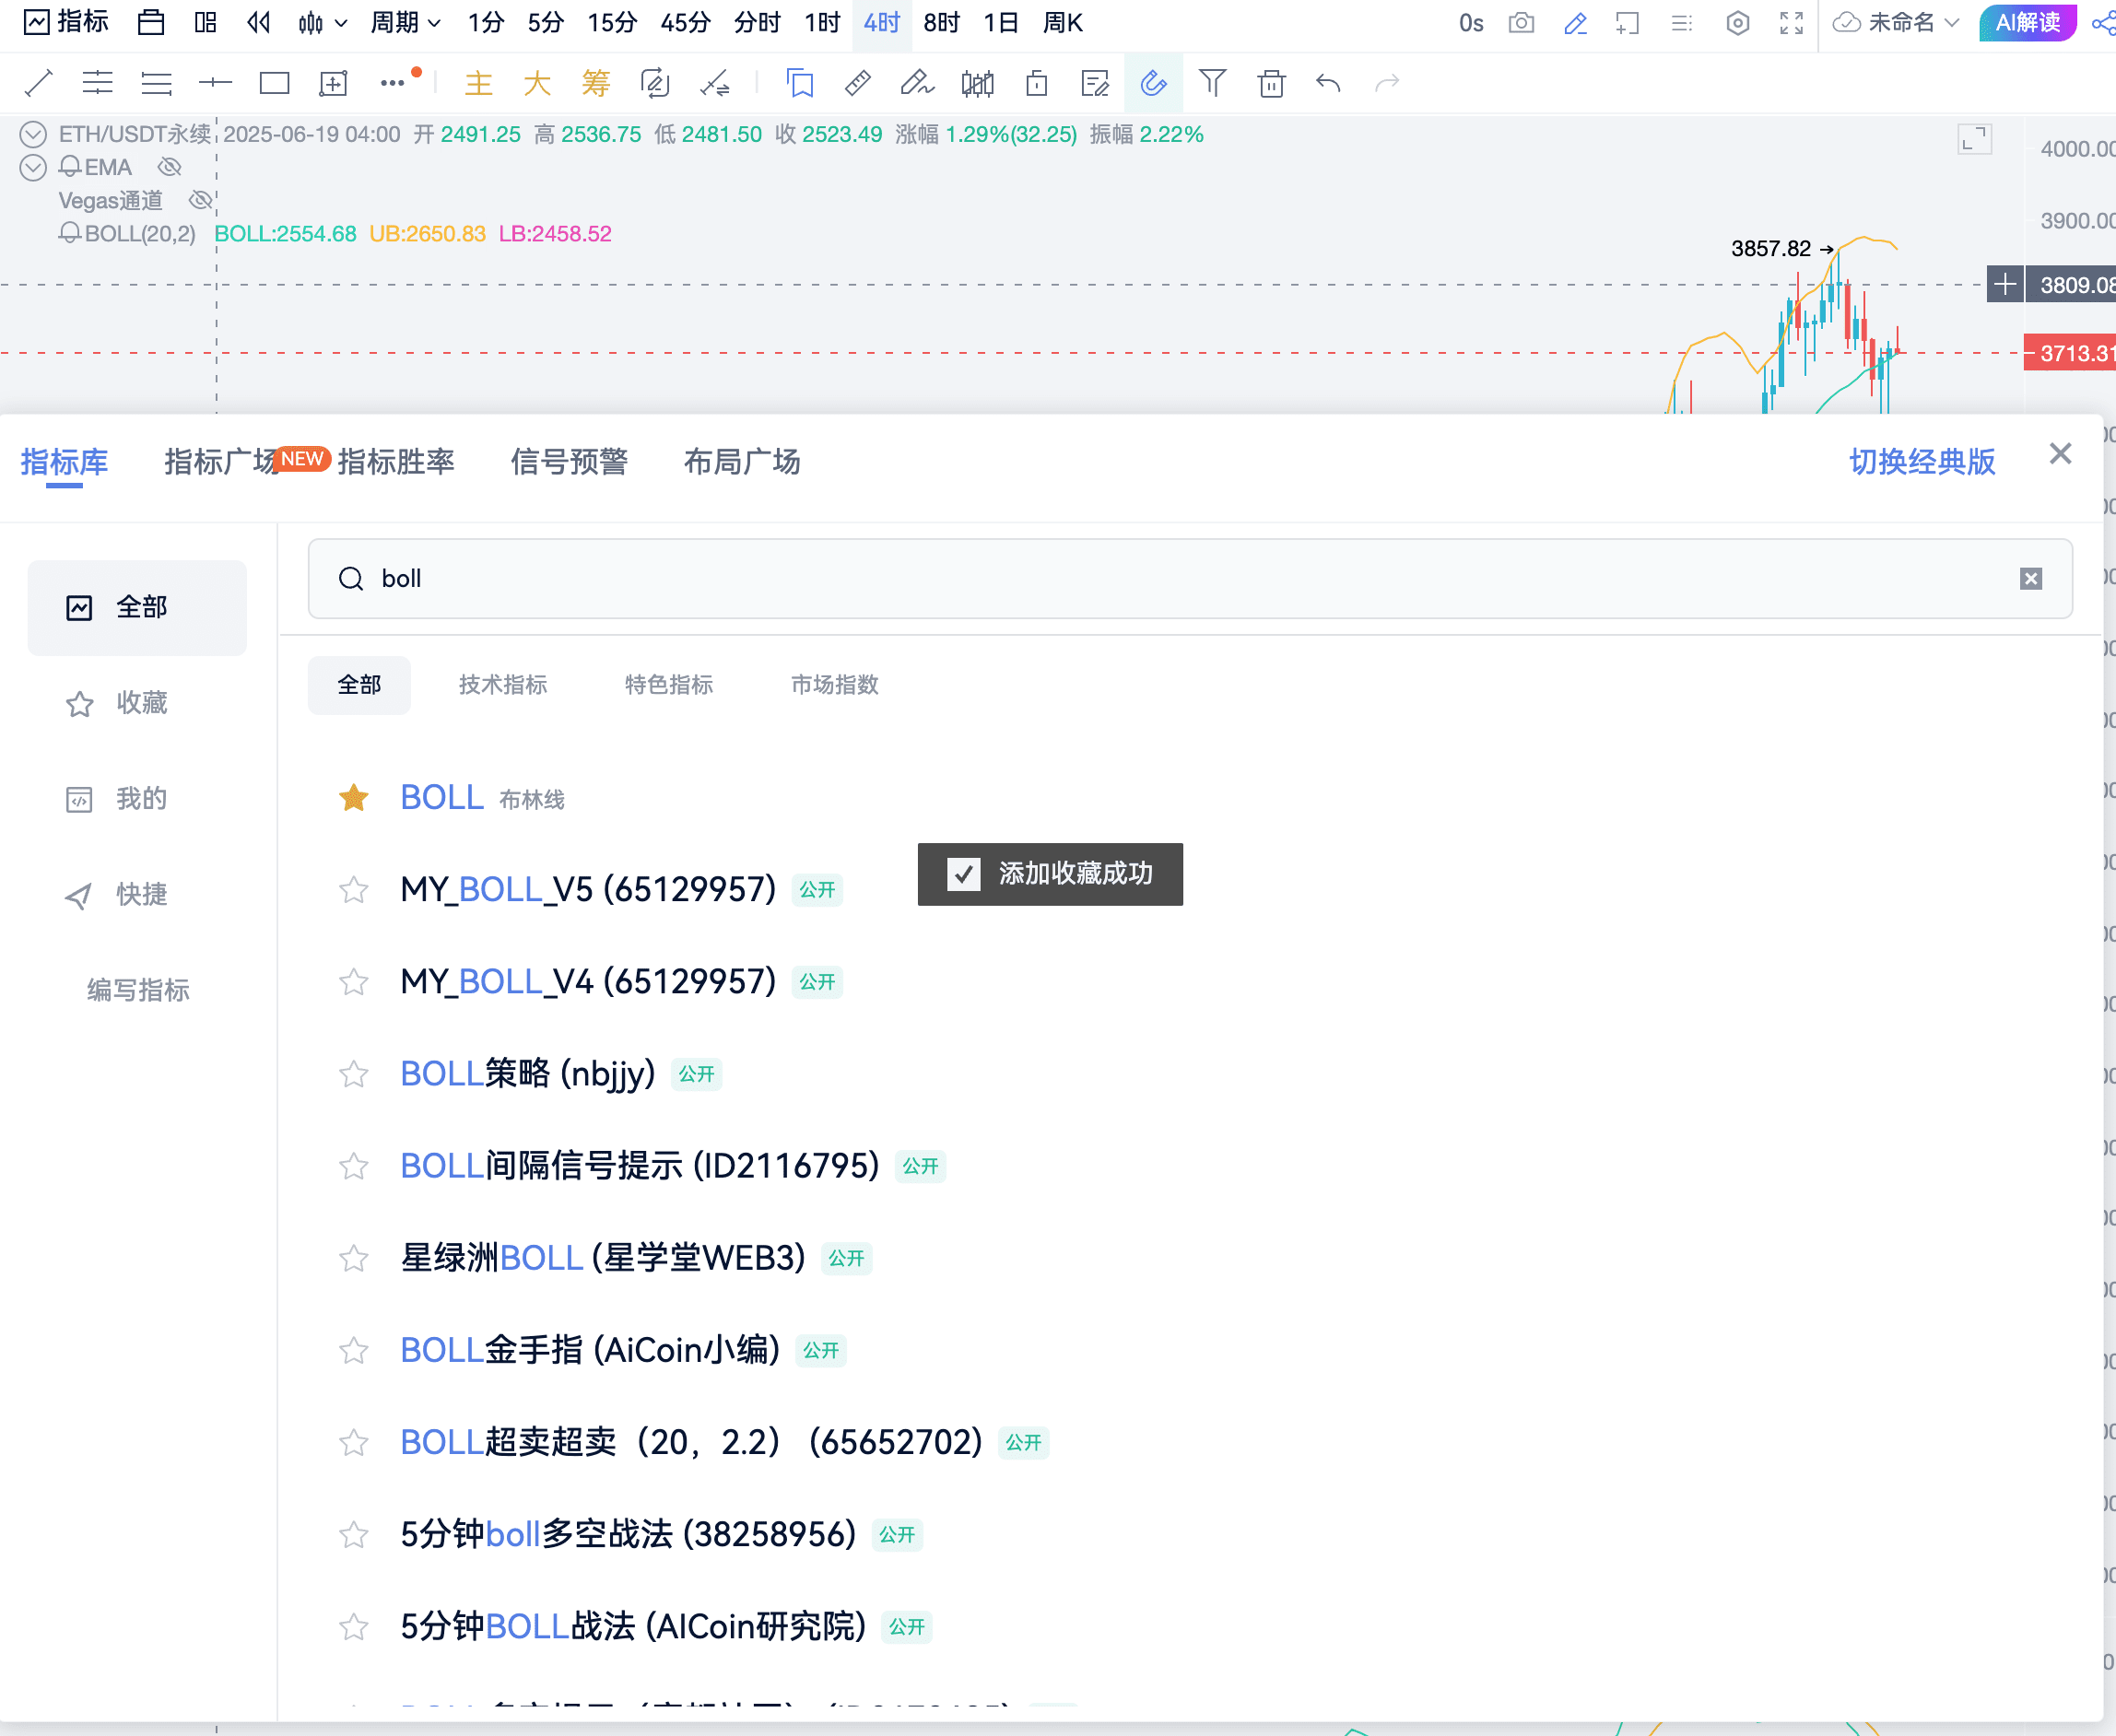
1.2 Set Parameters
In trading software, the default parameters for Bollinger Bands are usually:
Middle Rail Period: 20
Standard Deviation: 2
These default values generally do not need to be changed.
1.3 Brief introduction to mathematical principles
Bollinger Bands are based on the concept of standard deviation in statistics:
Standard Deviation: An indicator that measures the degree of data fluctuation
2 times the standard deviation: Theoretically covers about 95% of price fluctuations
A price breakthrough of 2 times the standard deviation range means that abnormal fluctuations have occurred
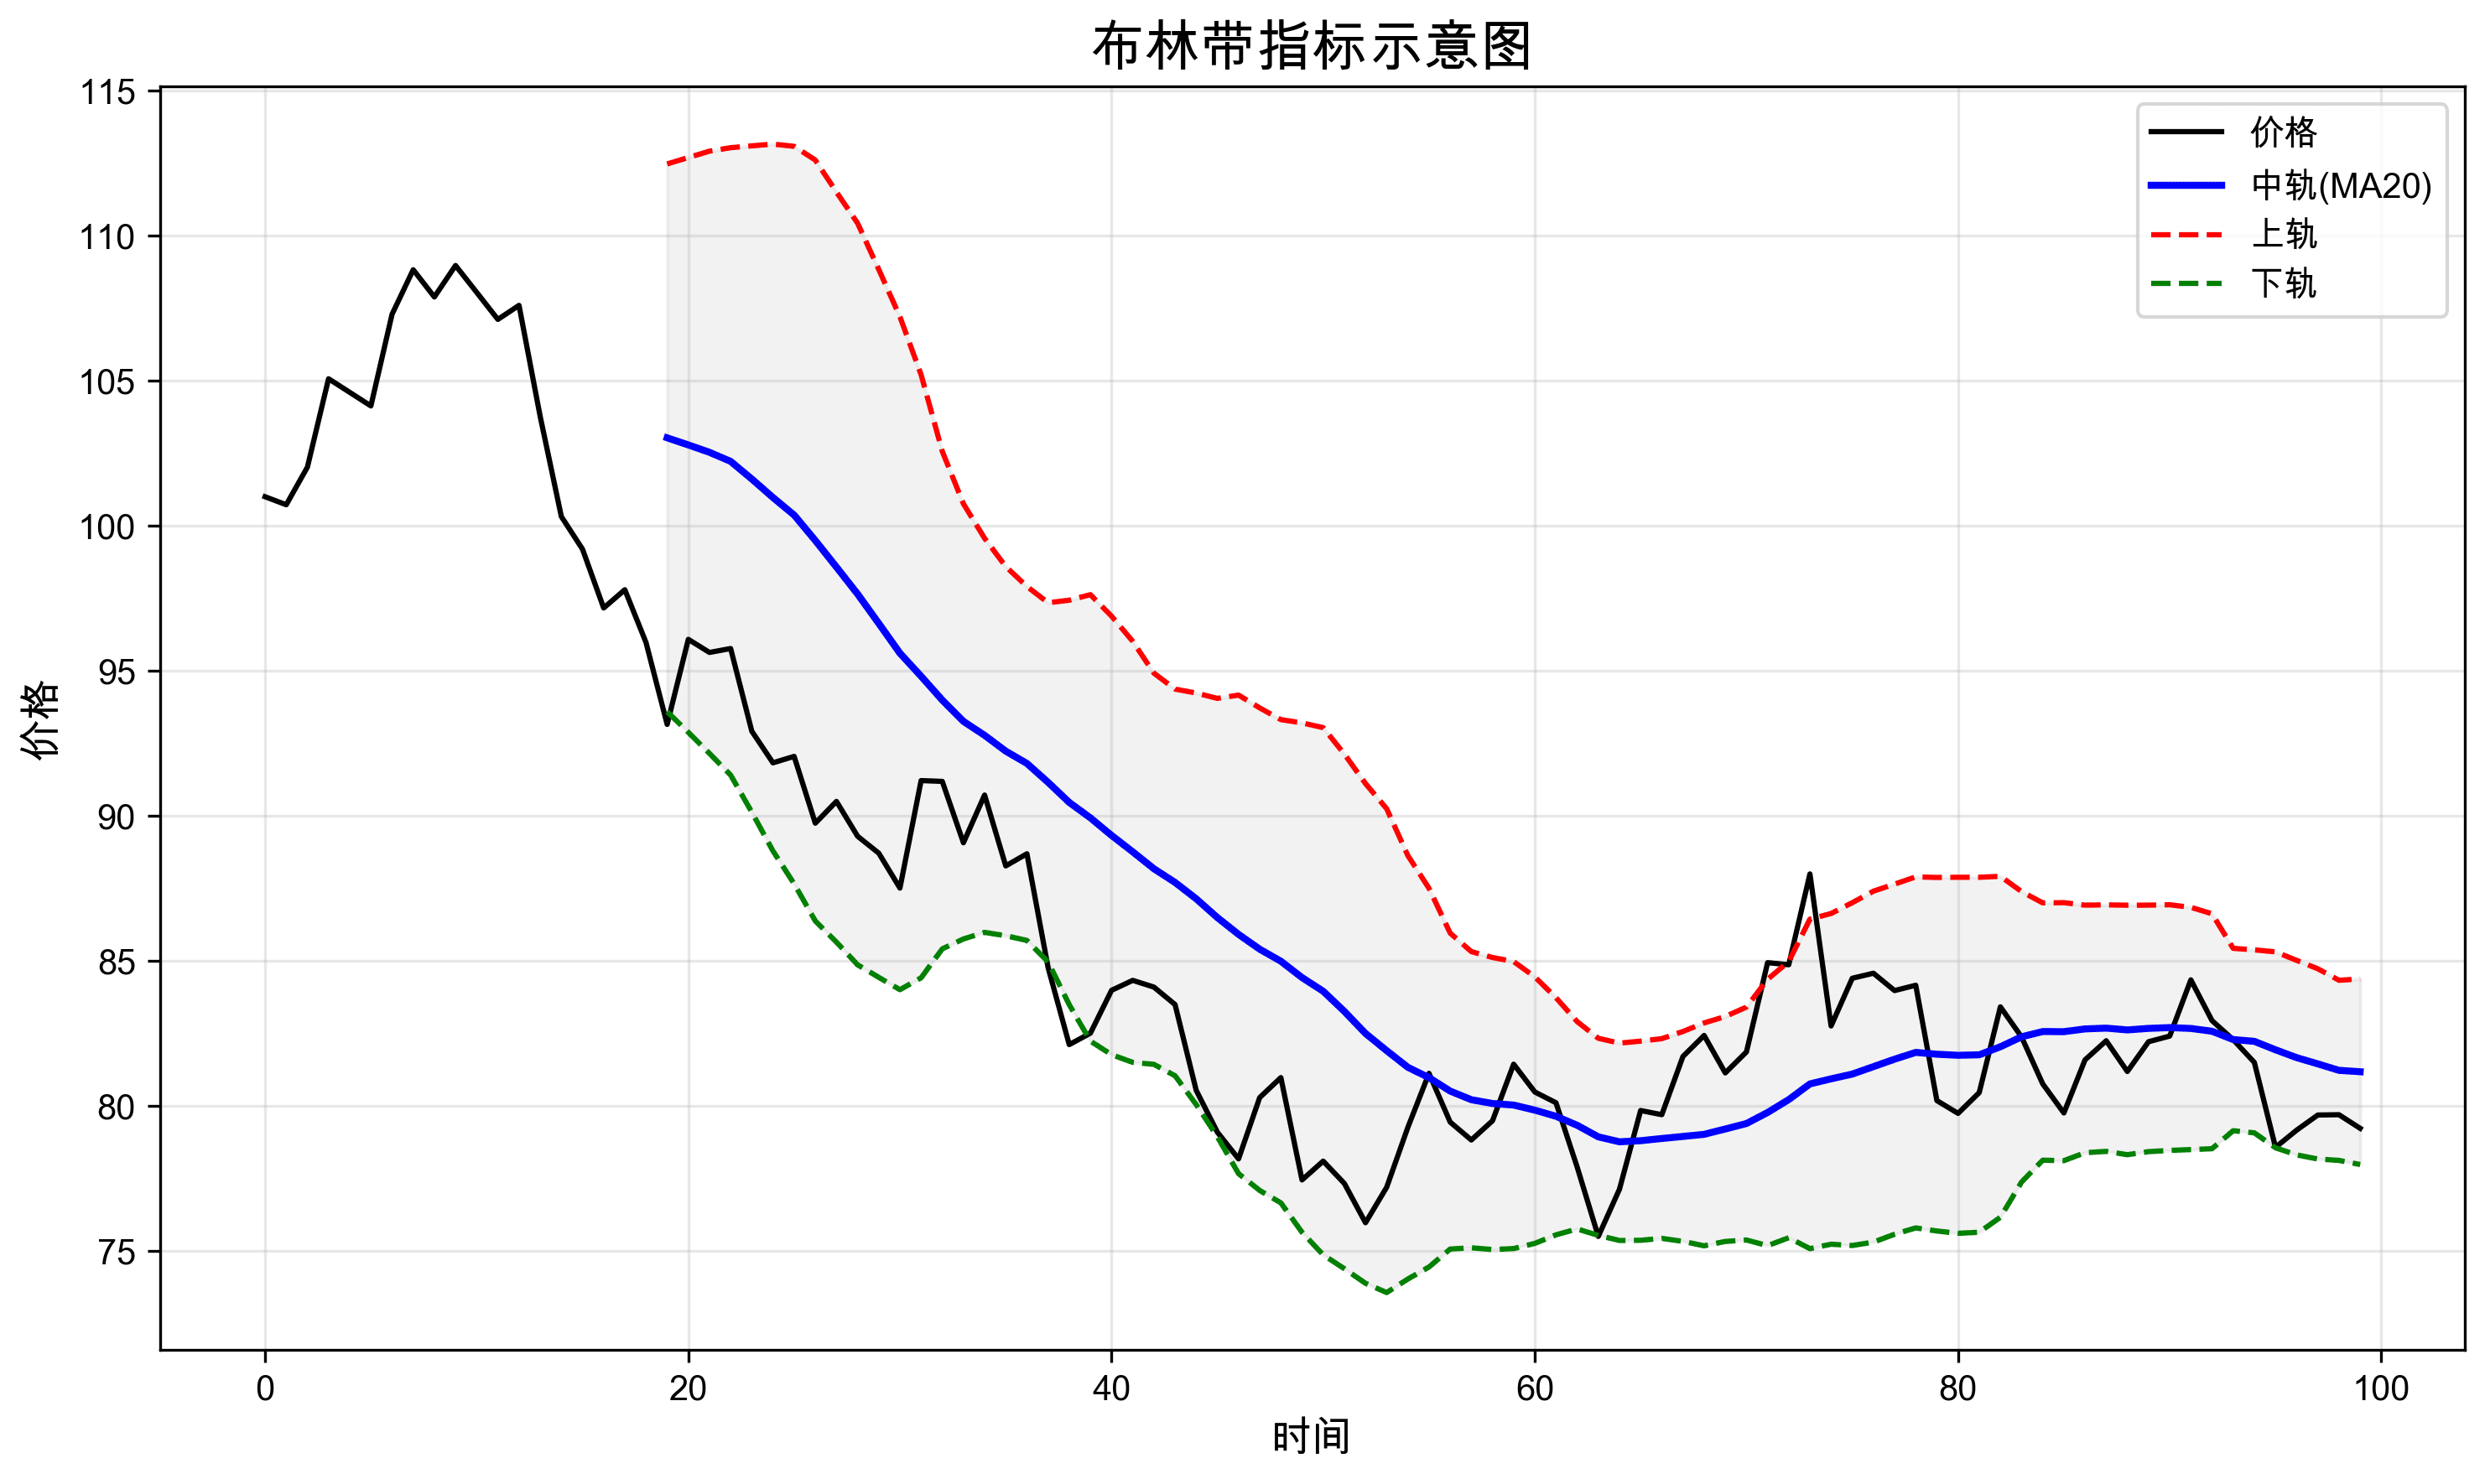
2. The operating cycle of Bollinger Bands: Widening and Narrowing
2.1 Basic Operational Rules
The operation of Bollinger Bands follows a simple cycle: Narrowing → Widening → Narrowing → Widening
Narrowing: The upper and lower rails converge towards the middle rail, representing a ranging market
Widening: The upper and lower rails move away from the middle rail, representing a trending market
2.2 How to determine the direction of the widening?
Observe the direction of the middle rail (MA20):
Middle rail upwards = widening upwards
Middle rail downwards = widening downwards
💡 Practical tip: The direction of the middle rail is more important than the shape of the upper and lower rails!
3. The core usage of Bollinger Bands: Judging reversals
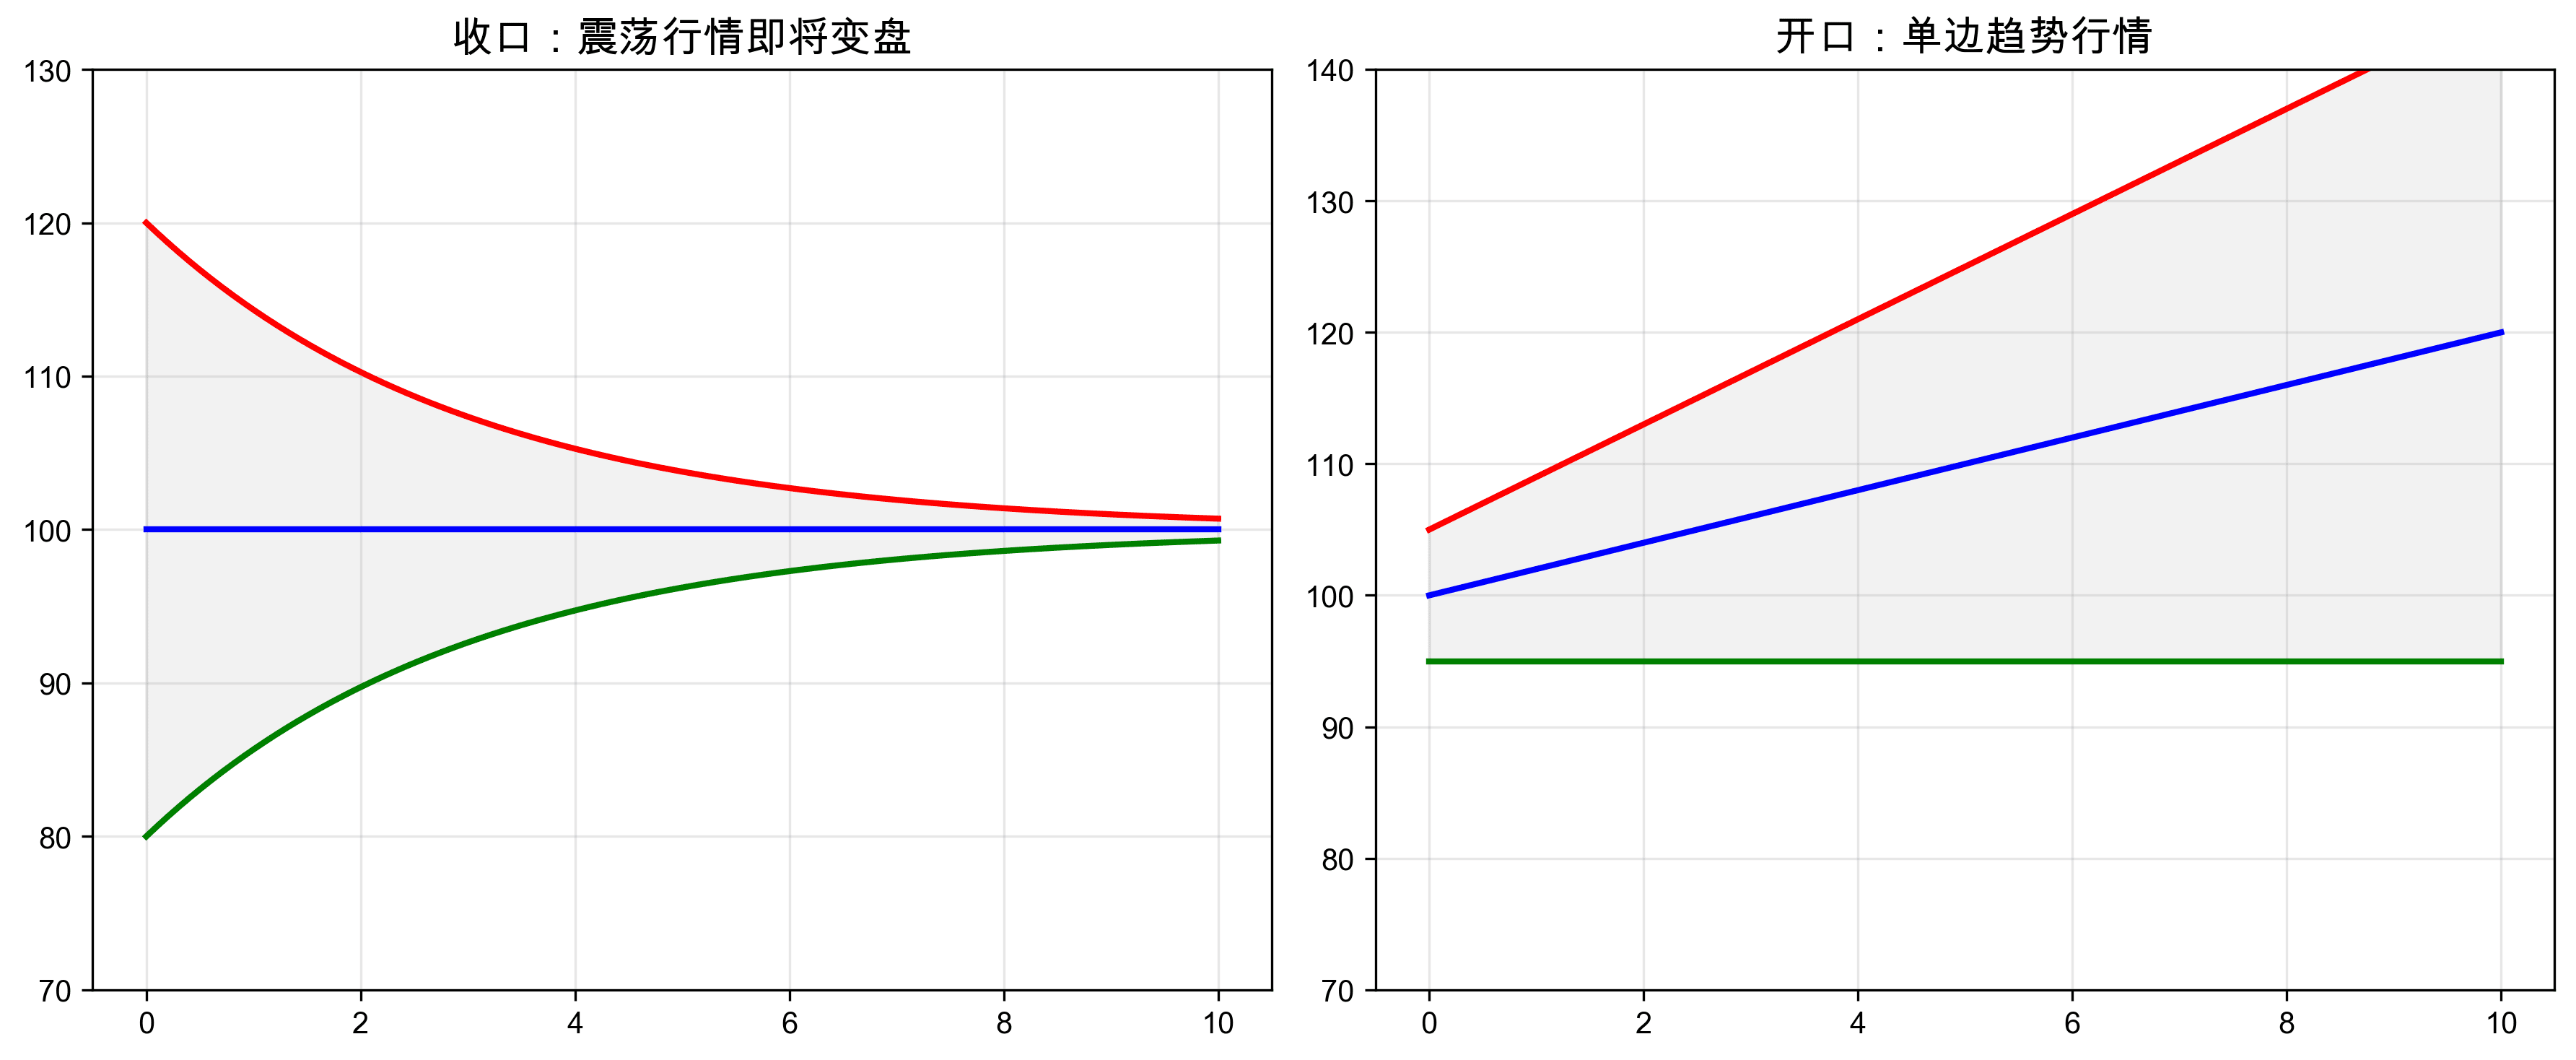
3.1 Narrowing means a reversal is coming
This is the most important use of Bollinger Bands! Whenever the Bollinger Bands narrow, be vigilant because:
Bollinger Bands narrowing = a reversal is about to occur
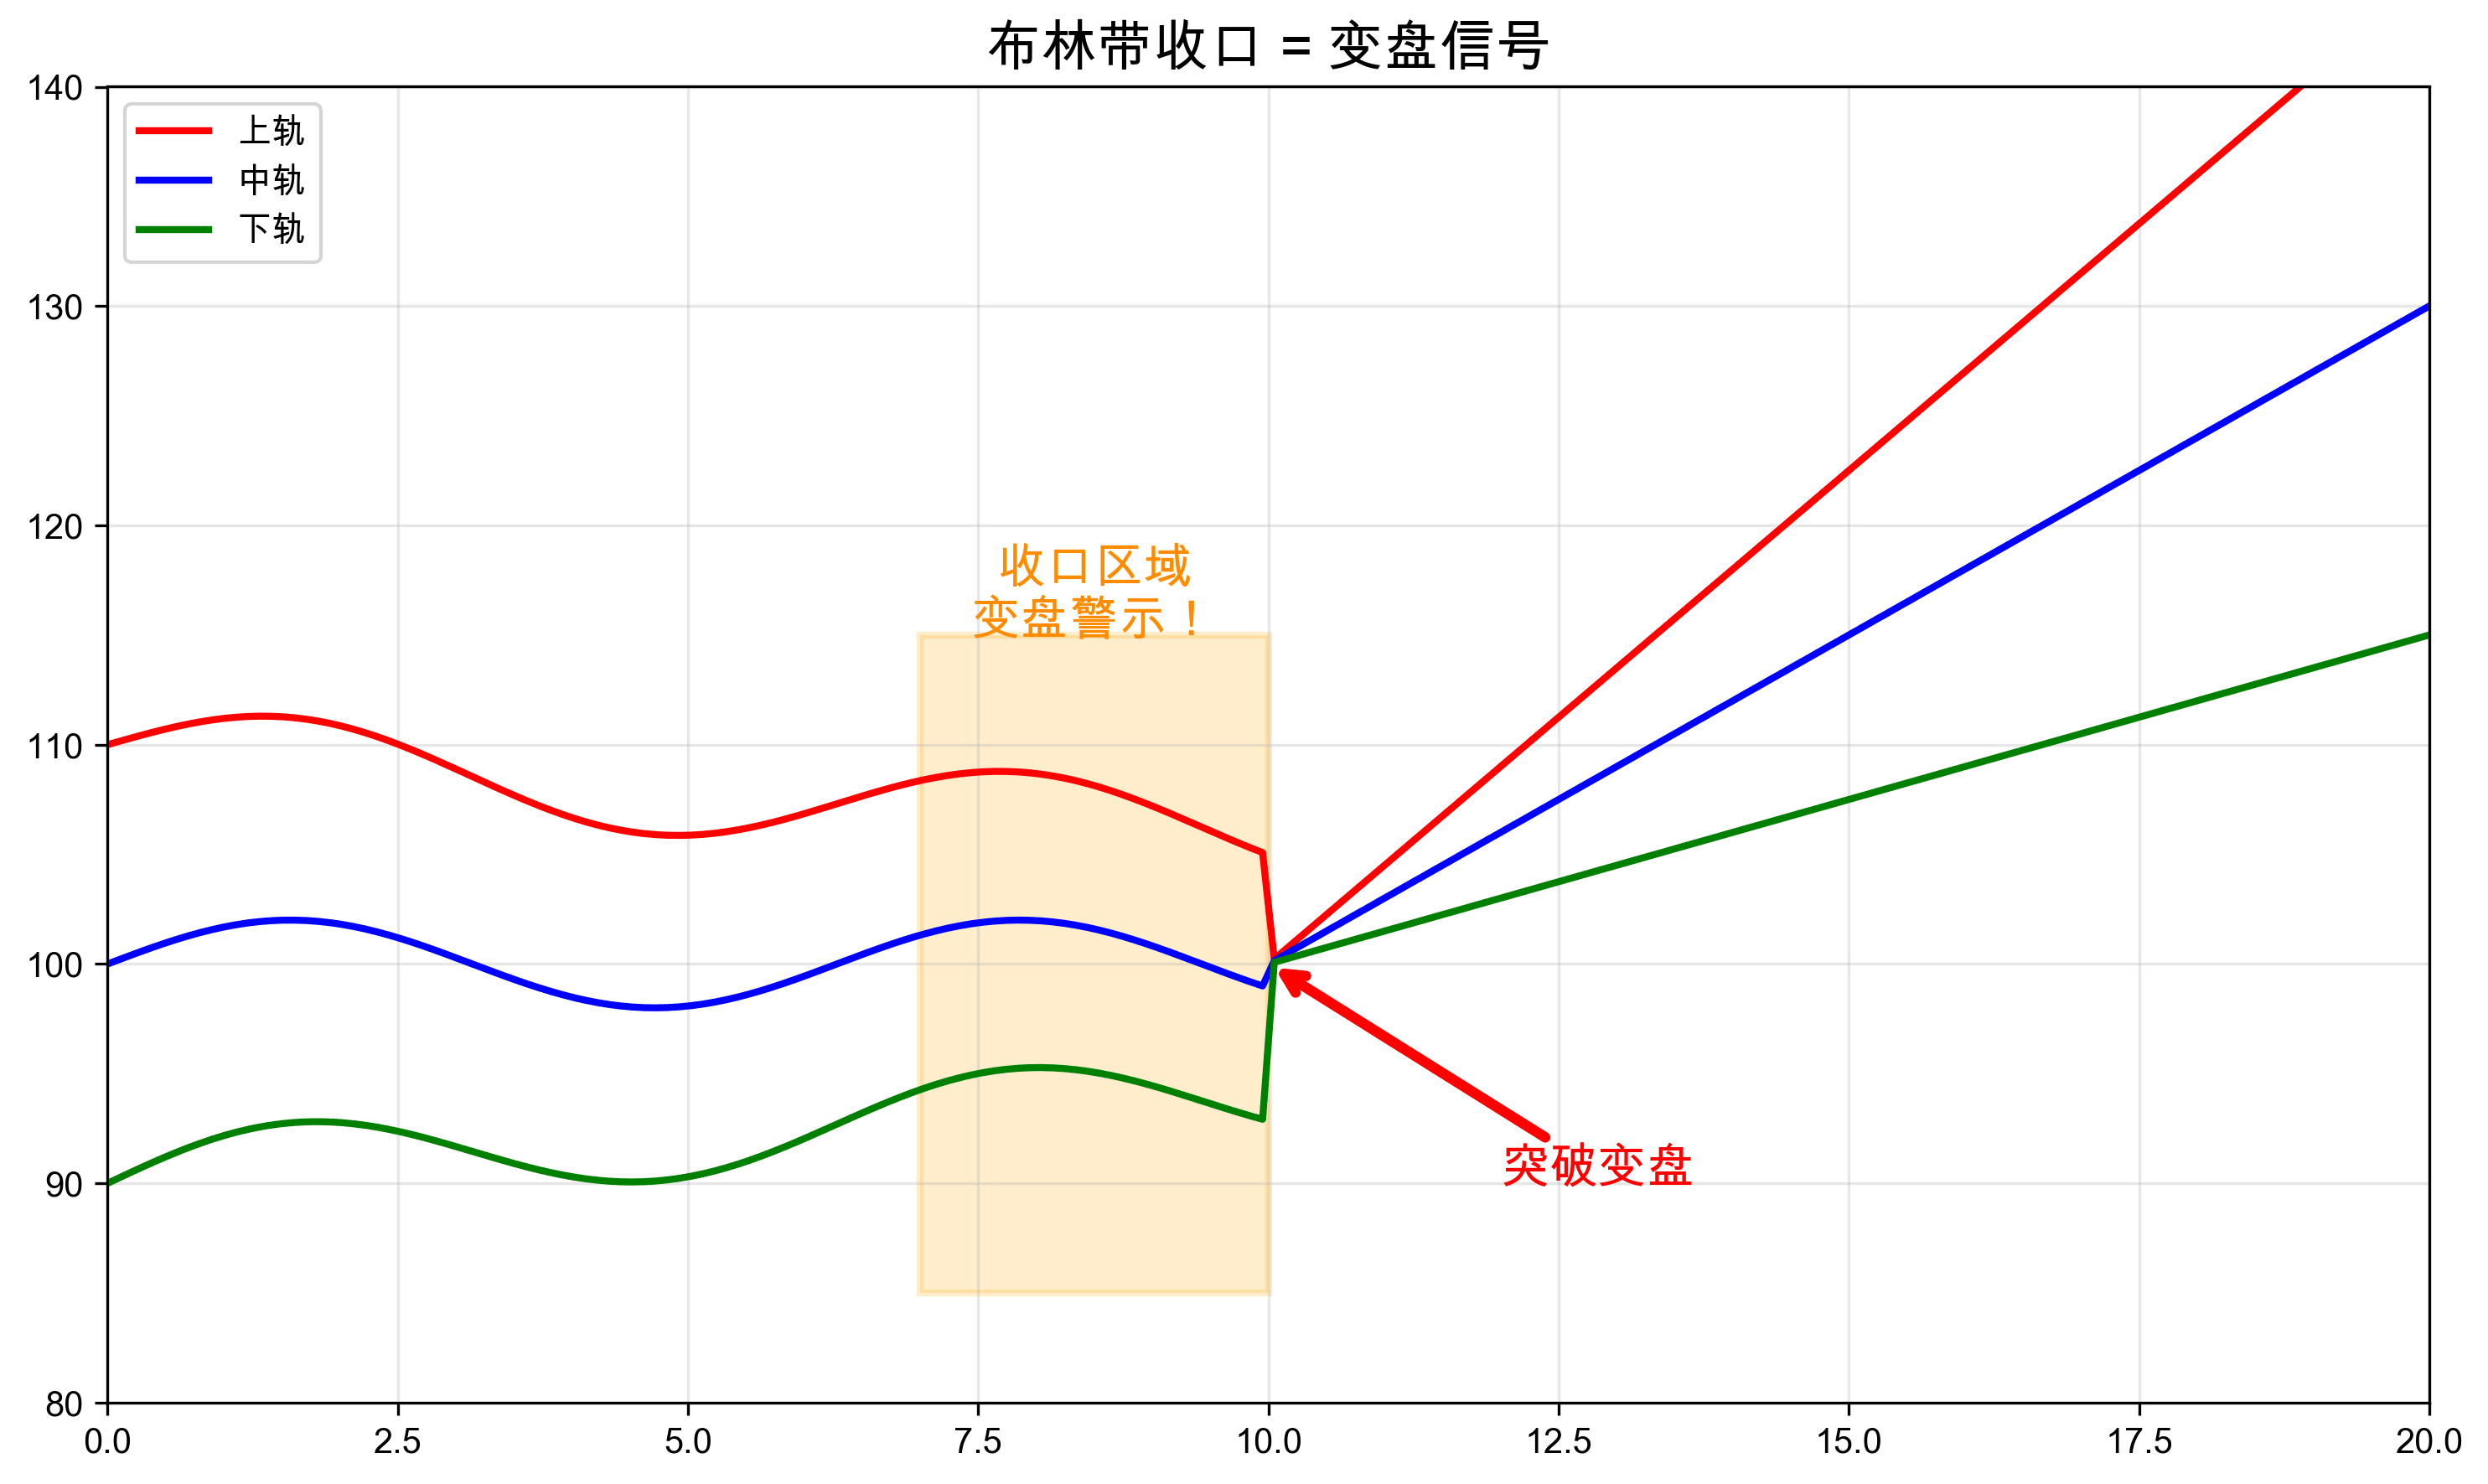
3.2 Determine the direction with widening, but pay attention to whether the K-line breaks through
Simple widening cannot determine a big trend, the key is to look at:
Whether the K-line entity breaks through the upper rail → High probability of a trending upward market
Whether the K-line entity breaks through the lower rail → High probability of a trending downward market
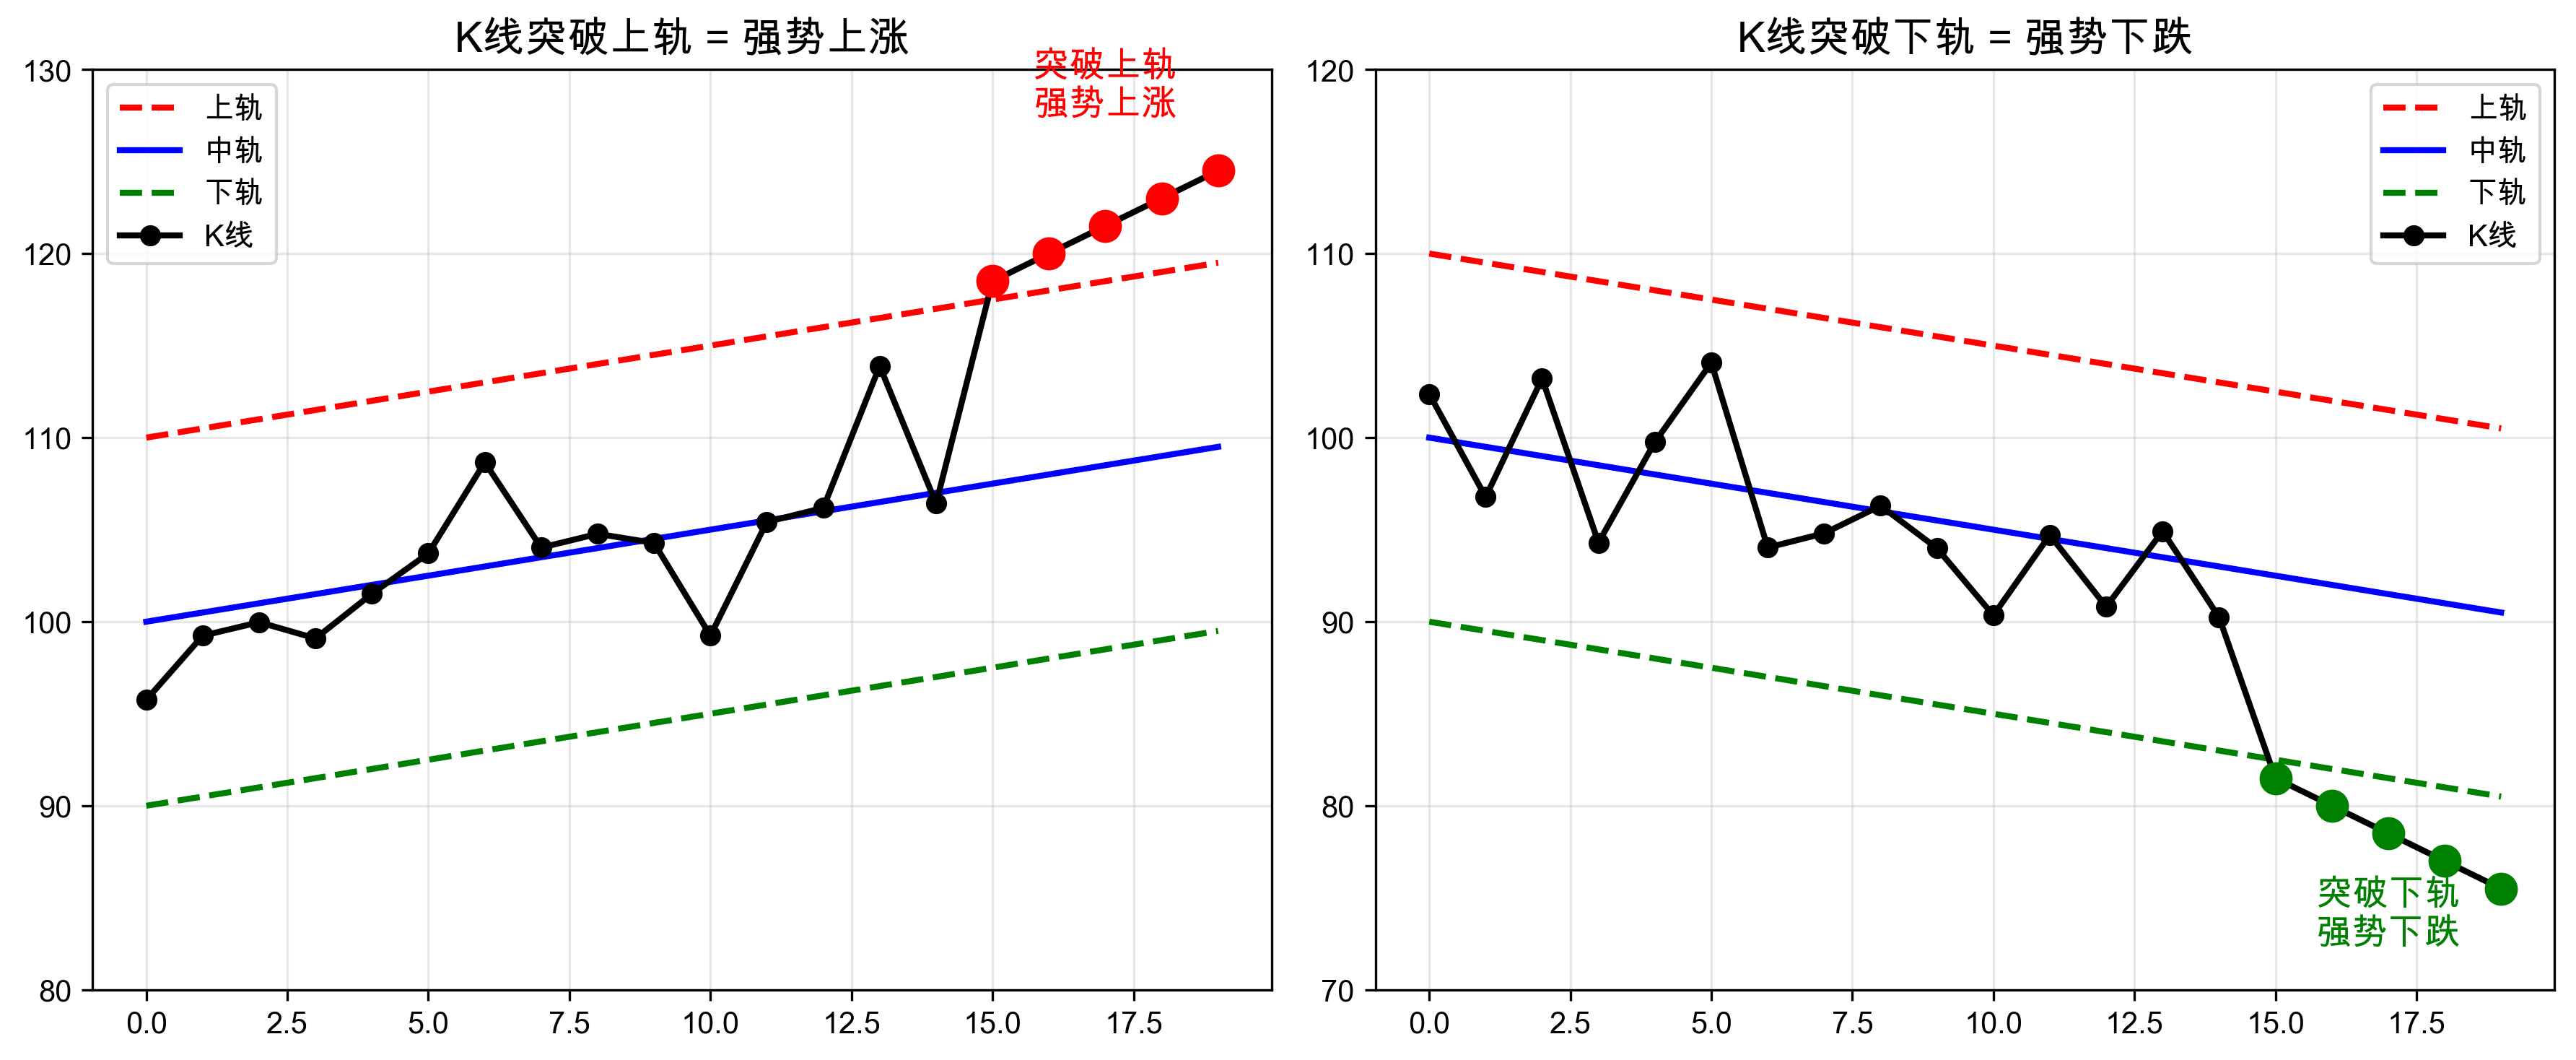
If the K-line does not break through the upper and lower rails, even if the Bollinger Bands widen, the range of the rise or fall will be very limited.
4. The trap of Bollinger Bands: The misunderstanding of upper rail resistance
4.1 Ranging Market vs. Trending Market
Many people believe that "the upper rail has resistance and the lower rail has support", but this is only true in specific situations:
Ranging market (narrowing state): The upper rail does have resistance, and the lower rail does have support ✓
Trending market (widening state): The pressure and support of the upper and lower rails are ineffective ✗
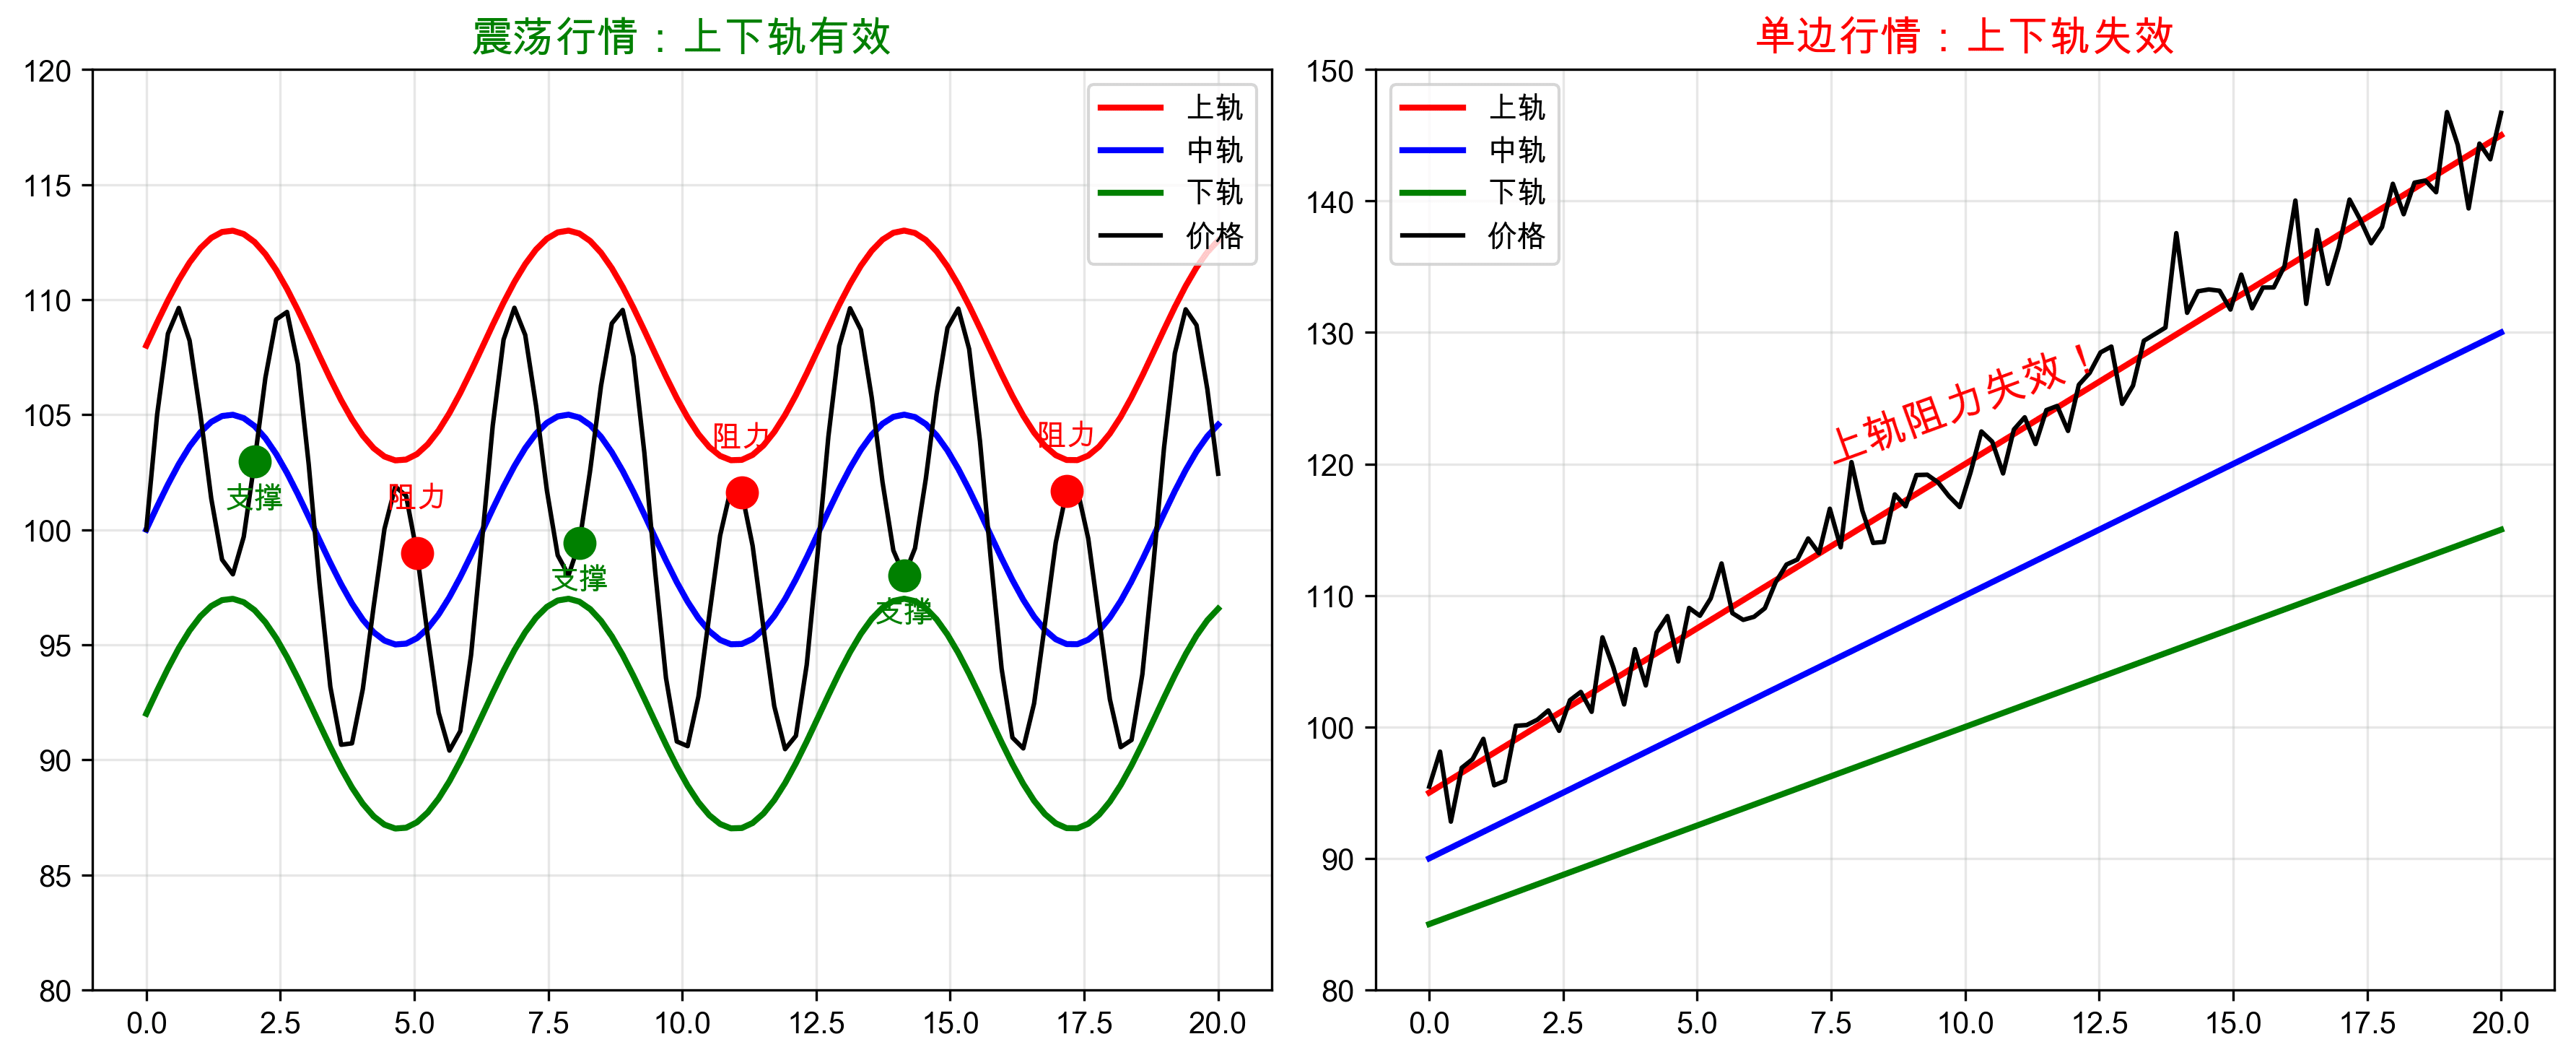
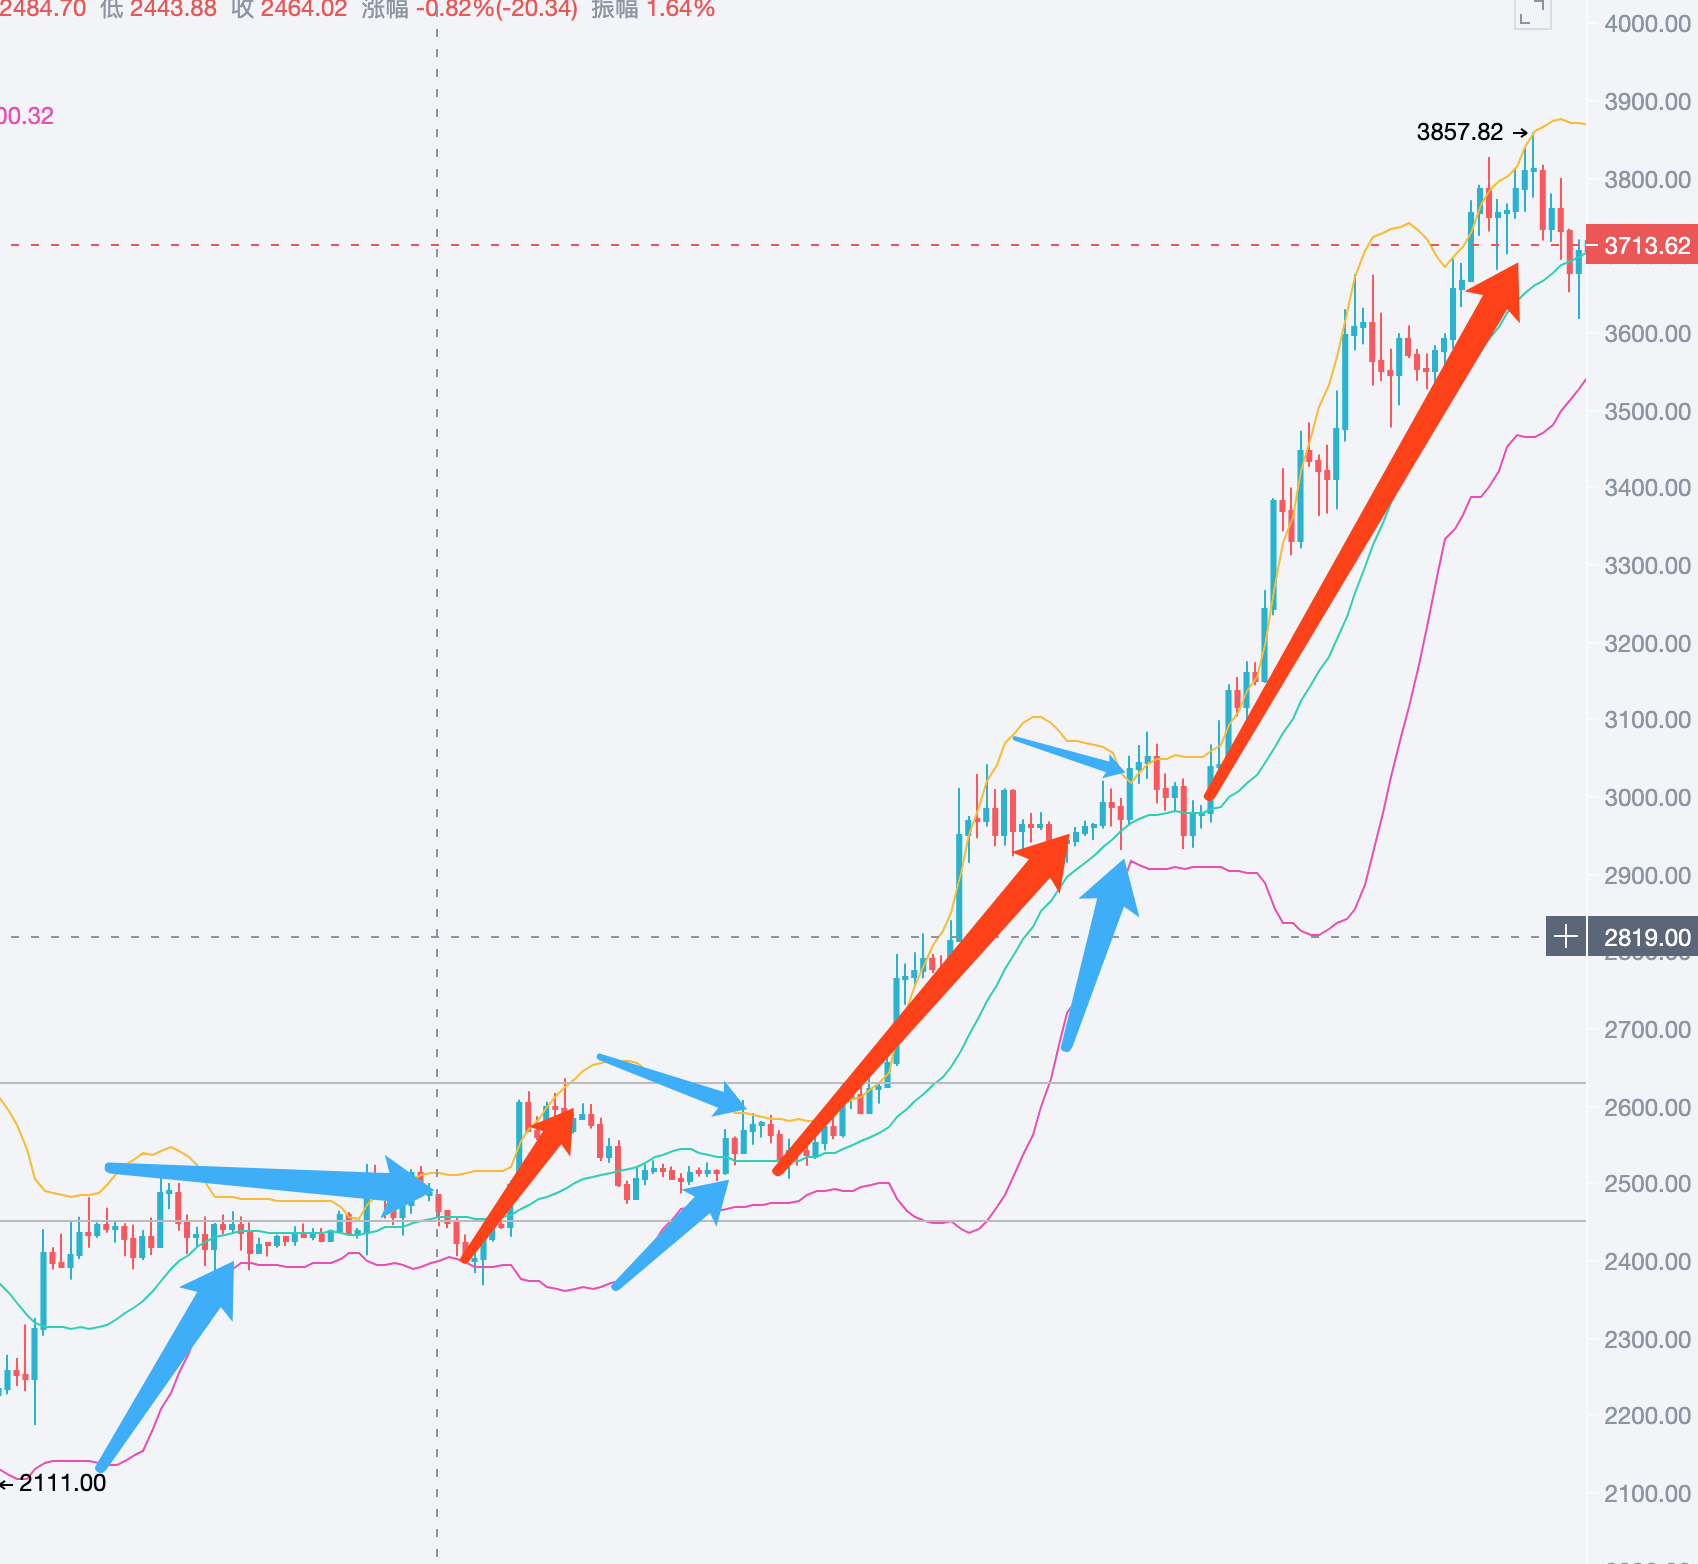
4.2 Why does the upper rail "fail" in a trending market?
In a strong trending market, if you short at the upper rail, you may carry the order all the way to liquidation. For example:
Short at 3800, the maximum floating loss may be up to 4200
Every small pullback makes you feel like "hope is coming", but the result is continuous new highs
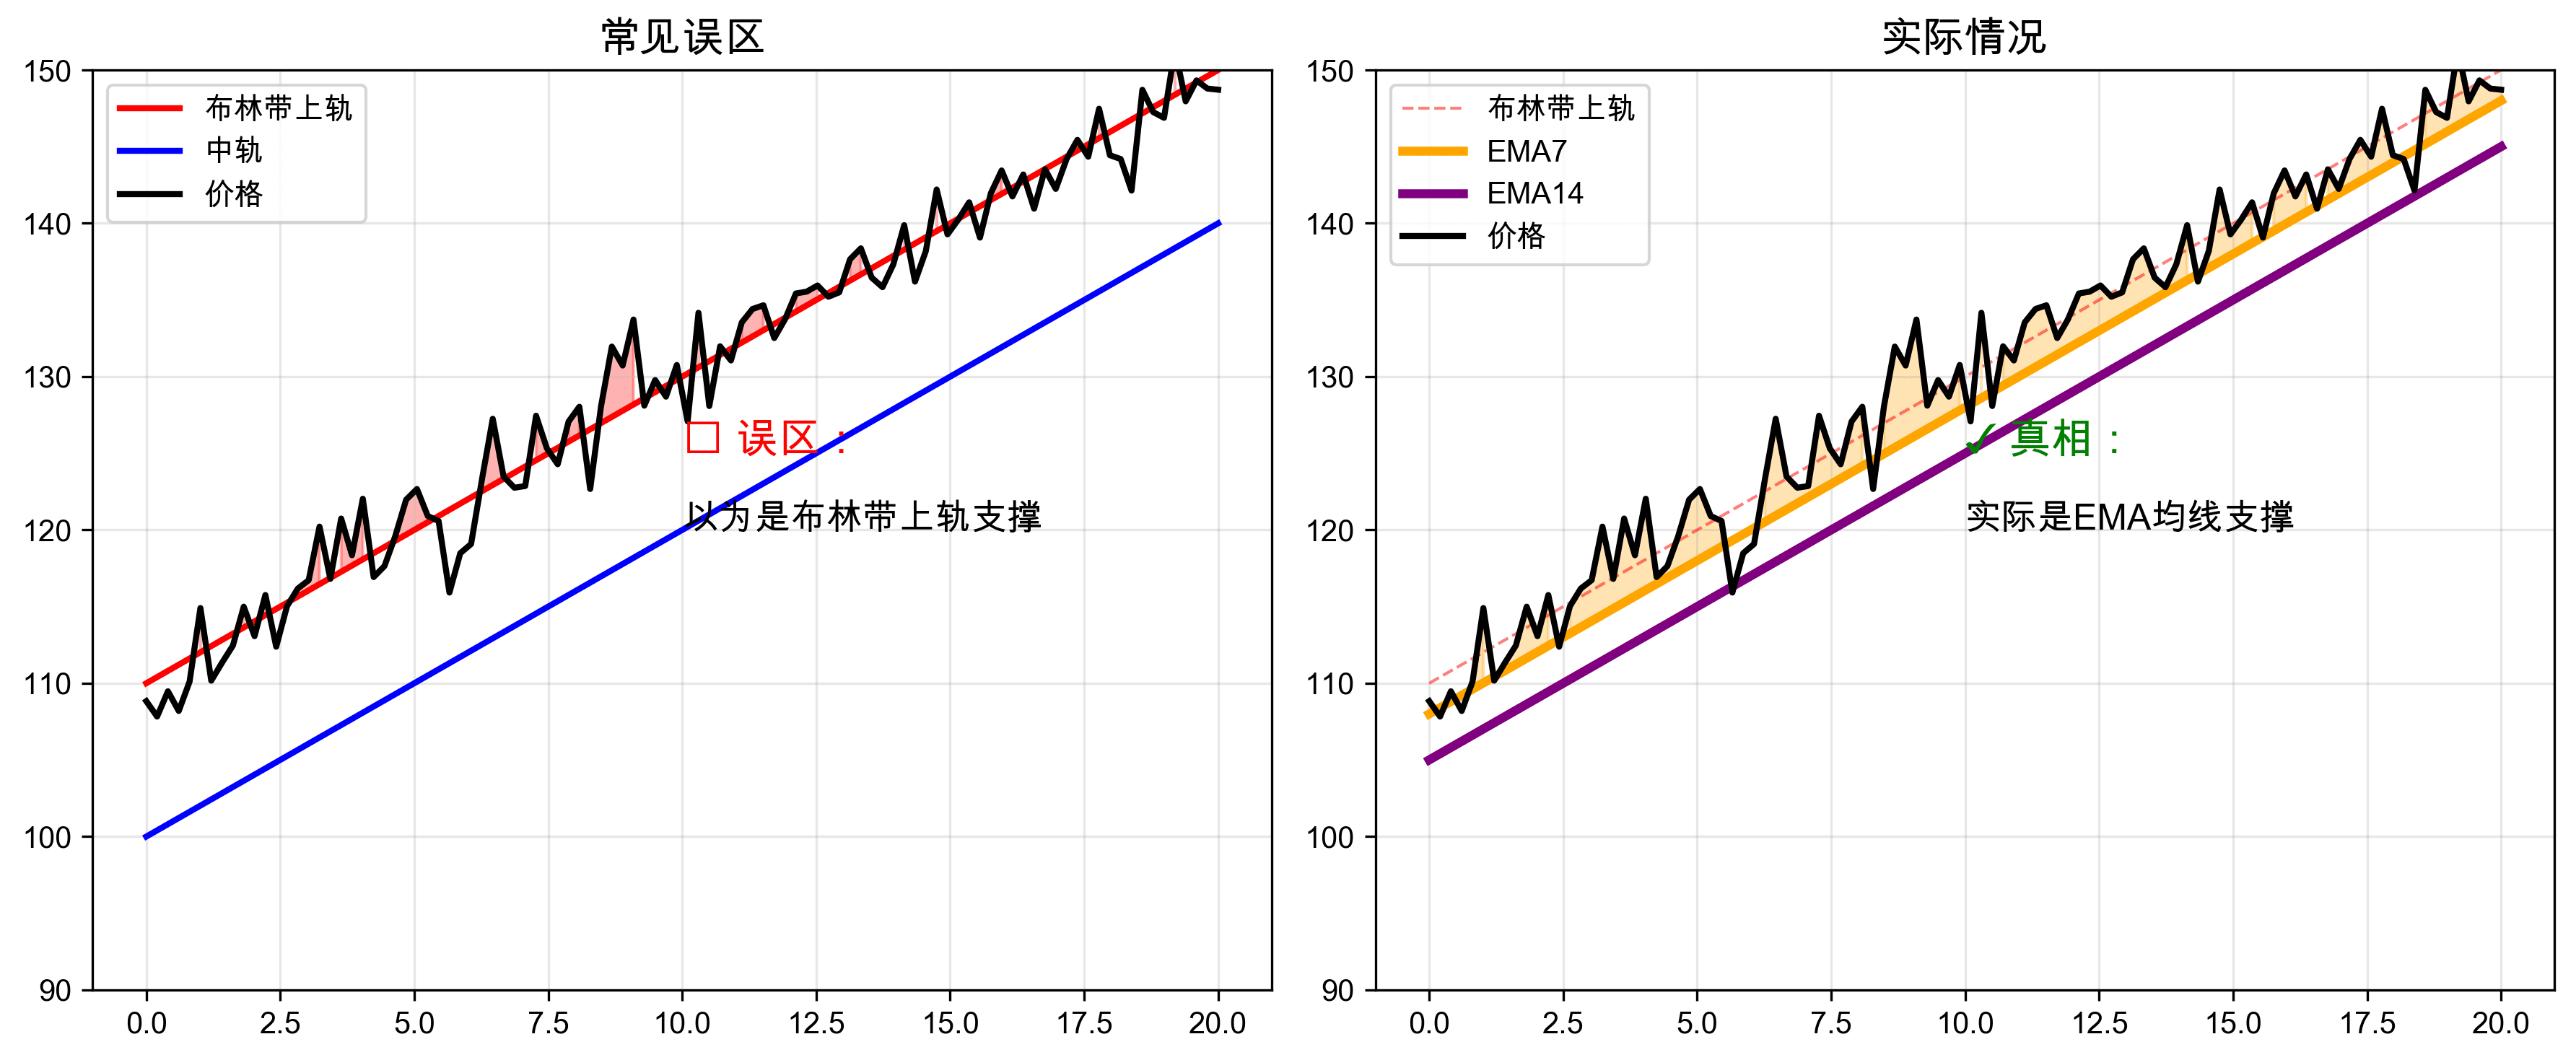
4.3 Truth: It's not the upper rail of the Bollinger Bands that is supporting
In a large trending market, it seems that the K-line is supported by the upper rail of the Bollinger Bands, but in reality:
The K-line rises strongly along EMA7 or EMA14
The upper rail of the Bollinger Bands just happens to coincide with a certain EMA moving average
The real support comes from the EMA moving average, not the Bollinger Bands
5. Practical Application: How to correctly use Bollinger Bands
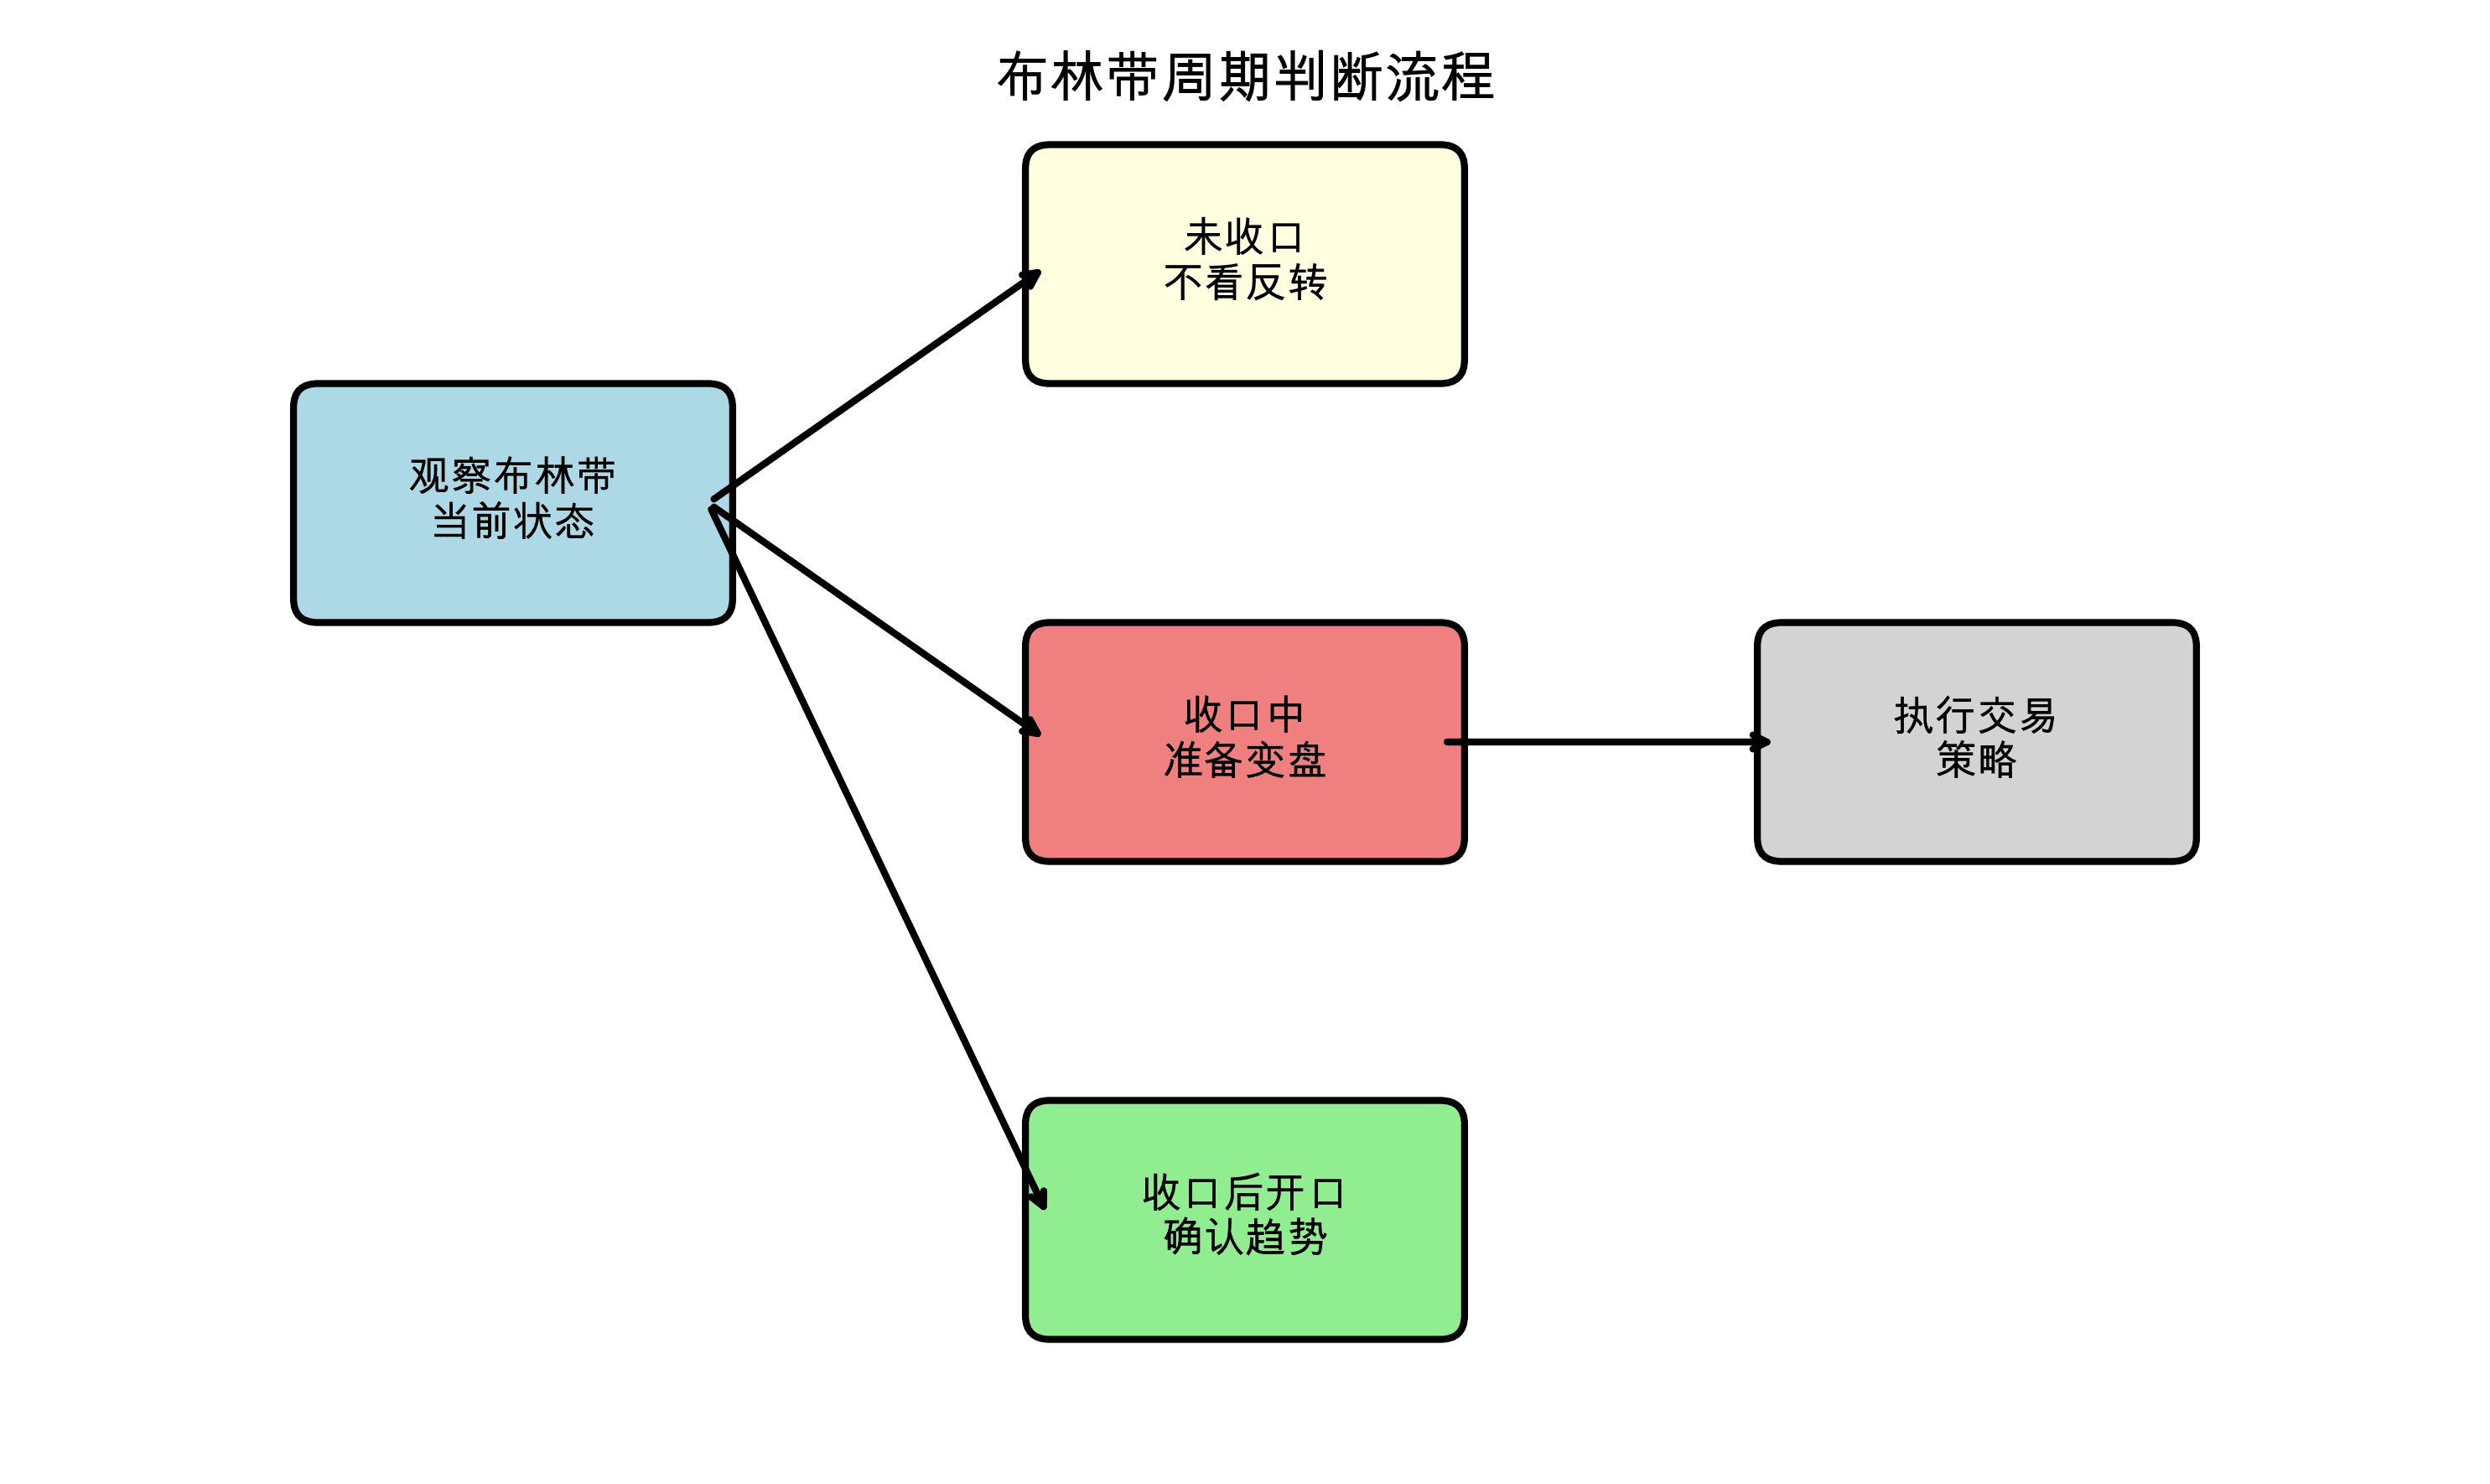
5.1 Use Bollinger Bands to predict market cycles
What cycle are you currently in? How might it develop in the future?
Bollinger Bands have not narrowed → Do not easily look for a reversal
Bollinger Bands are narrowing → Prepare to welcome a reversal
Narrowing then widening → Confirm the direction of the new trend
For example: Many people see an increase and shout for a reversal, but at that time the Bollinger Bands had not narrowed, so I judged that this was just a rebound, not a reversal.
5.2 Use in conjunction with other indicators
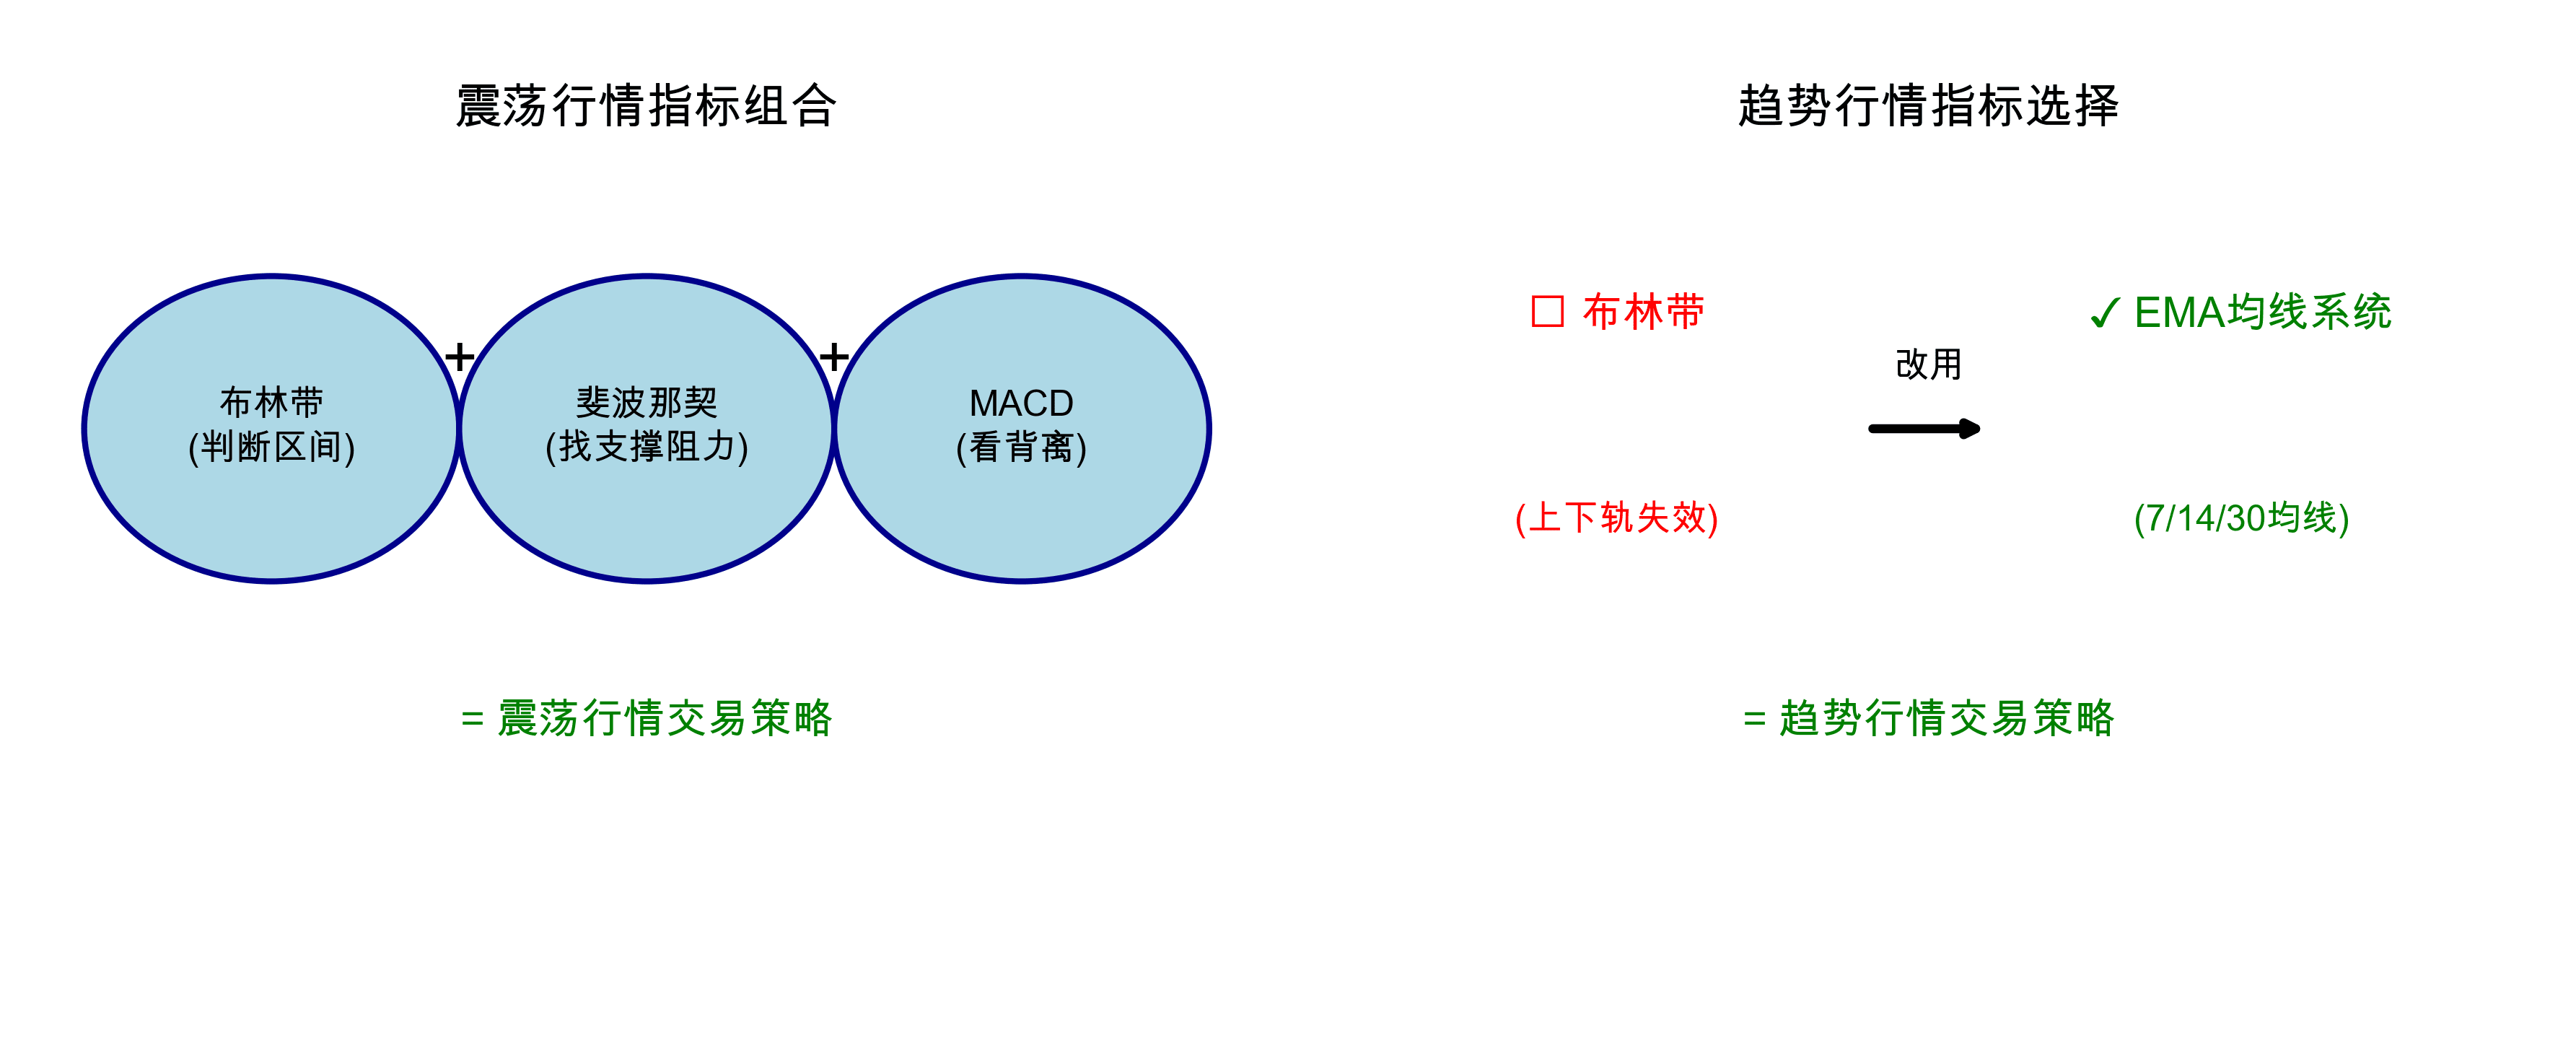
Remember: Bollinger Bands are auxiliary indicators and need to be used in conjunction with:
Ranging market: Bollinger Bands + Fibonacci + MACD divergence
Trending market: Abandon Bollinger Bands and use the EMA moving average system instead
5.3 Application of Different Time Periods
Intraday short-term: Bollinger Bands have limited effect
Medium to long-term: Bollinger Bands are more accurate in judging reversals
6. Summary: The correct way to use Bollinger Bands
Core usage: Judge reversals through narrowing, rather than simply looking at the upper and lower rails
Biggest Misconception: Shorting at the upper rail and going long at the lower rail in a trending market
Correct mindset: Bollinger Bands are an auxiliary tool, not the main decision-making basis
Practical Key Points:
Narrowing = preparing for a reversal
Widening + K-line breakthrough = confirming the trend
Use EMA in trending markets, use Bollinger Bands in ranging markets
Finally, if you could make money by simply using Bollinger Bands, trading would be too easy. The real value of Bollinger Bands is to help you confirm and support your judgment, rather than directly giving buy and sell signals.
Remember: Trading is a systematic project, and no single indicator can make you consistently profitable. But if you can correctly understand and use Bollinger Bands, it can indeed "add the finishing touch" to your trading decisions at crucial moments.
7. Frequently Asked Questions
Q1: How long after the Bollinger Bands narrow will a reversal occur?
A: There is no fixed time, it could be from a few hours to a few days, you need to confirm with other signals.
Q2: Can I only use Bollinger Bands for trading?
A: Not recommended. Bollinger Bands are an auxiliary tool and need to be used in conjunction with other indicators.
Q3: Why do I always lose money using Bollinger Bands?
A: It may be because you mistakenly used the upper and lower rails as support and resistance in a trending market.
Q4: Do the Bollinger Band parameters need to be adjusted?
A: Generally not needed, the default 20 days and 2 times the standard deviation are applicable to most situations.
This article is organized according to A Leng's K-line teaching and is for learning and reference only and does not constitute investment advice.
📊 More trading tips, follow A Leng