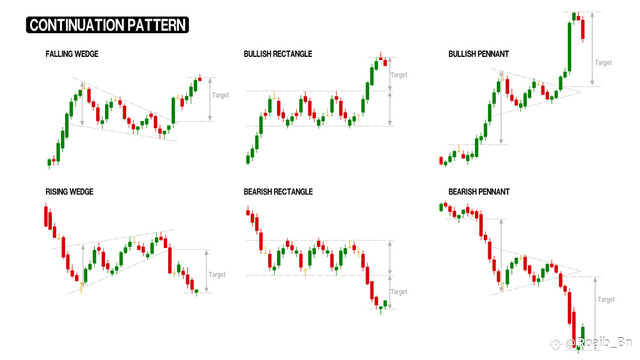
📉 Falling Wedge (Bullish)
A downward-sloping pattern showing price compression. A breakout to the upside often signals a strong bullish move.
📈 Rising Wedge (Bearish)
Price climbs while narrowing — often a sign of weakness. Once support breaks, expect a sharp downside move.
🟩 Bullish Rectangle
Price consolidates in a horizontal range after an uptrend. A breakout above resistance confirms trend continuation.
🟥 Bearish Rectangle
A pause in a downtrend where price moves sideways. Break below support means the bearish trend resumes.
🚩 Bullish Pennant
Forms after a sharp rise, followed by a brief triangle-like consolidation. Breakout = continued uptrend.
🚩 Bearish Pennant
After a strong fall, price forms a tight range. Breakdown leads to more downside continuation.
HERE is the pattern image 👇
If you find the post helpful then please follow like and comment on it thanks 👍
#TrumpBitcoinEmpire #BTCvsETH #ETHBreaks3700 #StrategyBTCPurchase #GENIUSAct

