Ever looked at candlesticks and felt lost? These chart patterns are the language of the markets, revealing what traders are thinking before the big moves. Let’s break them down with clarity and confidence 👇
---
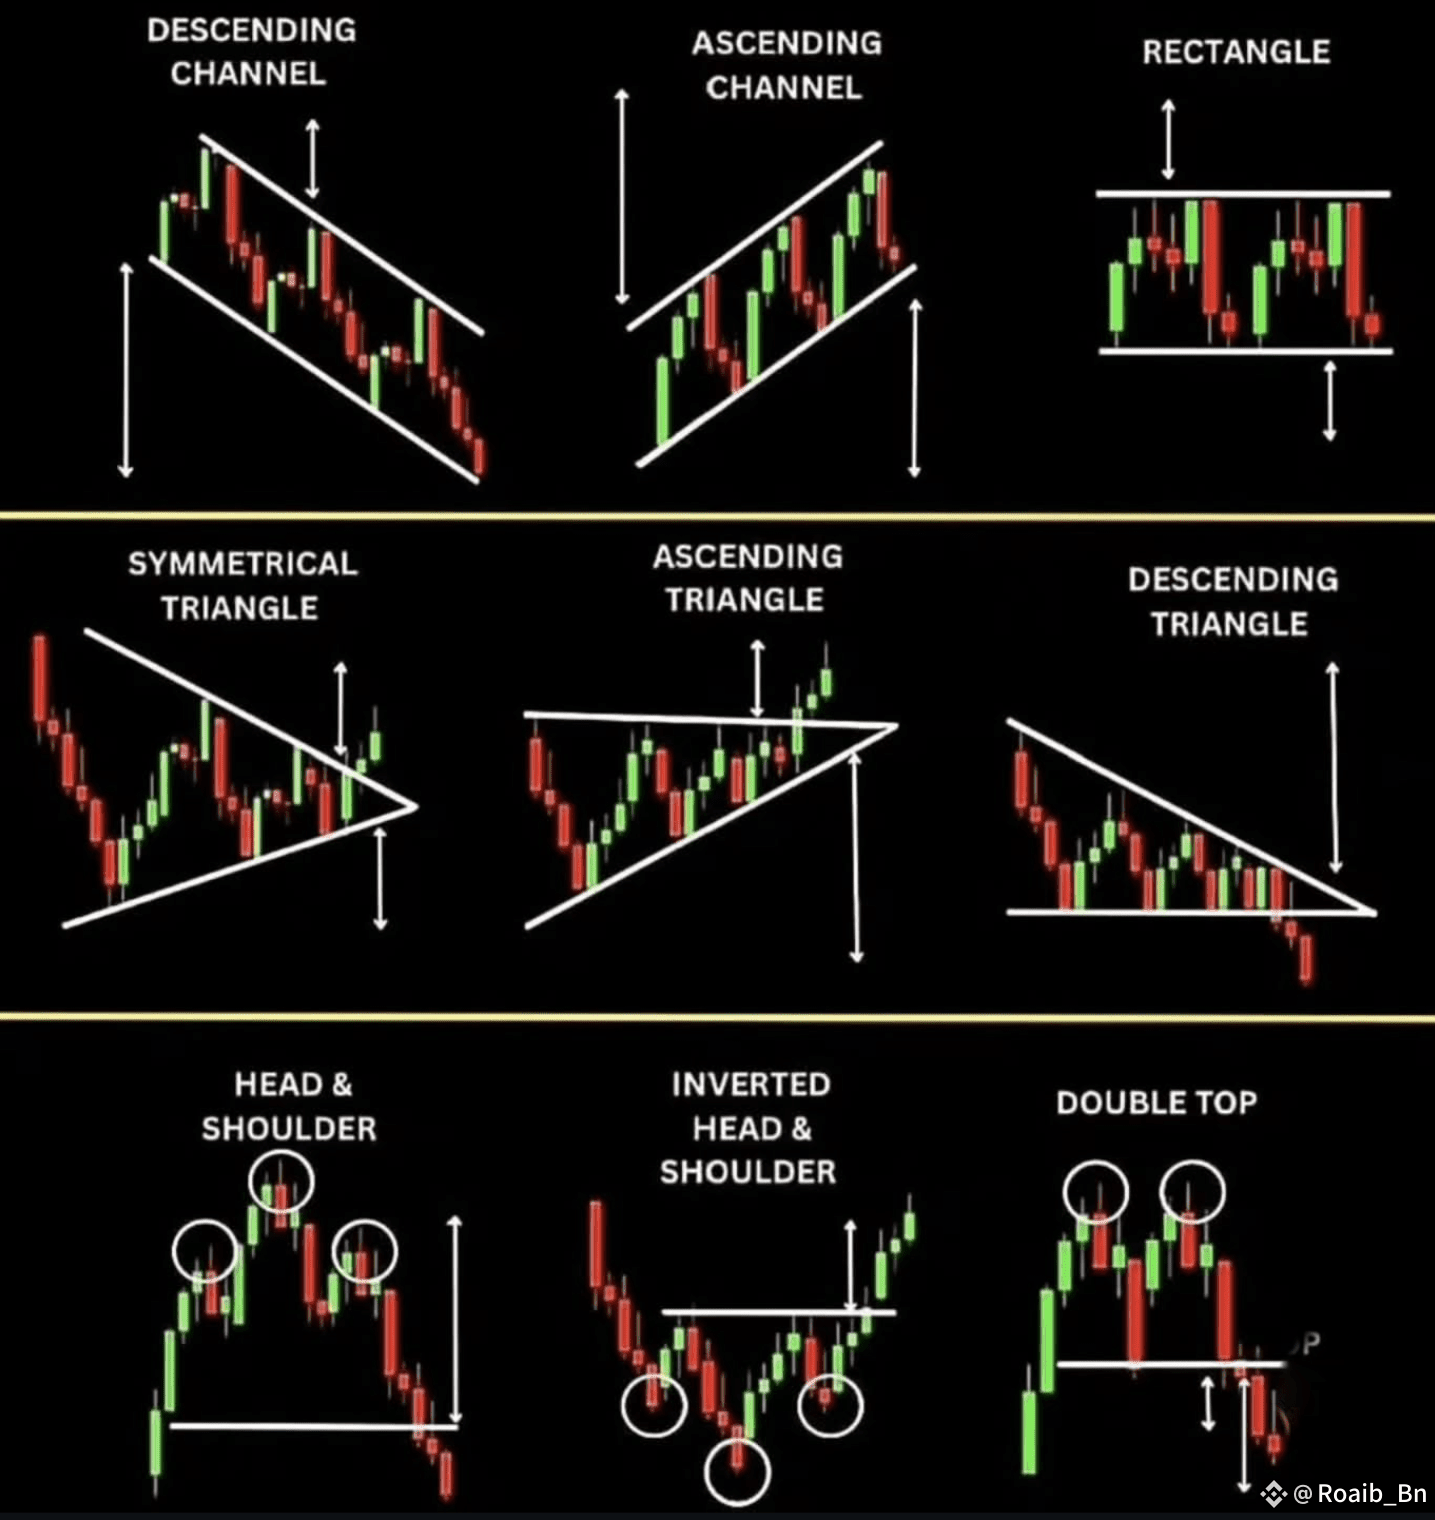
🔻 Descending Channel
A steady downtrend enclosed in parallel lines. Sellers dominate, but watch for bullish breakouts—they often come fast and fierce.
---
🔺 Ascending Channel
Rising highs and higher lows—buyers in control. But beware: sharp drops often follow after the momentum fades.
---
📦 Rectangle Pattern
Price trapped between horizontal support and resistance. Think of it as a pressure cooker—once it breaks, expect strong momentum either way.
---
🔼 Symmetrical Triangle
A battle between bulls and bears, tightening like a spring. The breakout is usually explosive—stay ready!
---
📈 Ascending Triangle
Flat top, rising bottom. This pattern shows buyers gaining strength, often leading to a bullish breakout.
---
📉 Descending Triangle
Flat support, falling highs. Sellers tighten their grip until the price breaks downward. A classic bearish signal.
---
🧠 Head & Shoulders
One of the most reliable reversal signals. This pattern shouts: "The trend is changing!"—from bullish to bearish.
---
🔄 Inverted Head & Shoulders
The ultimate sign of a bottom. When spotted in a downtrend, it often marks the beginning of a new bullish cycle.
---
⛰️ Double Top
A twin peak formation that signals strong resistance. Once the neckline breaks—expect a solid drop.
---
📌 HERE is the candles image 👇
✅ If you found this post helpful, please follow, like, and drop a comment!
Your support keeps the knowledge flowing 🔥
#CryptoScamSurge #AmericaAIActionPlan #BTRPreTGE #CryptoClarityAct #BNBBreaksATH