 $BNB 🤥In trading, divergence is the discrepancy between the price movement on the chart and the readings of the indicator, which can indicate a possible price reversal (from intermediate correction to a full trend change) or the continuation of the trending movement.
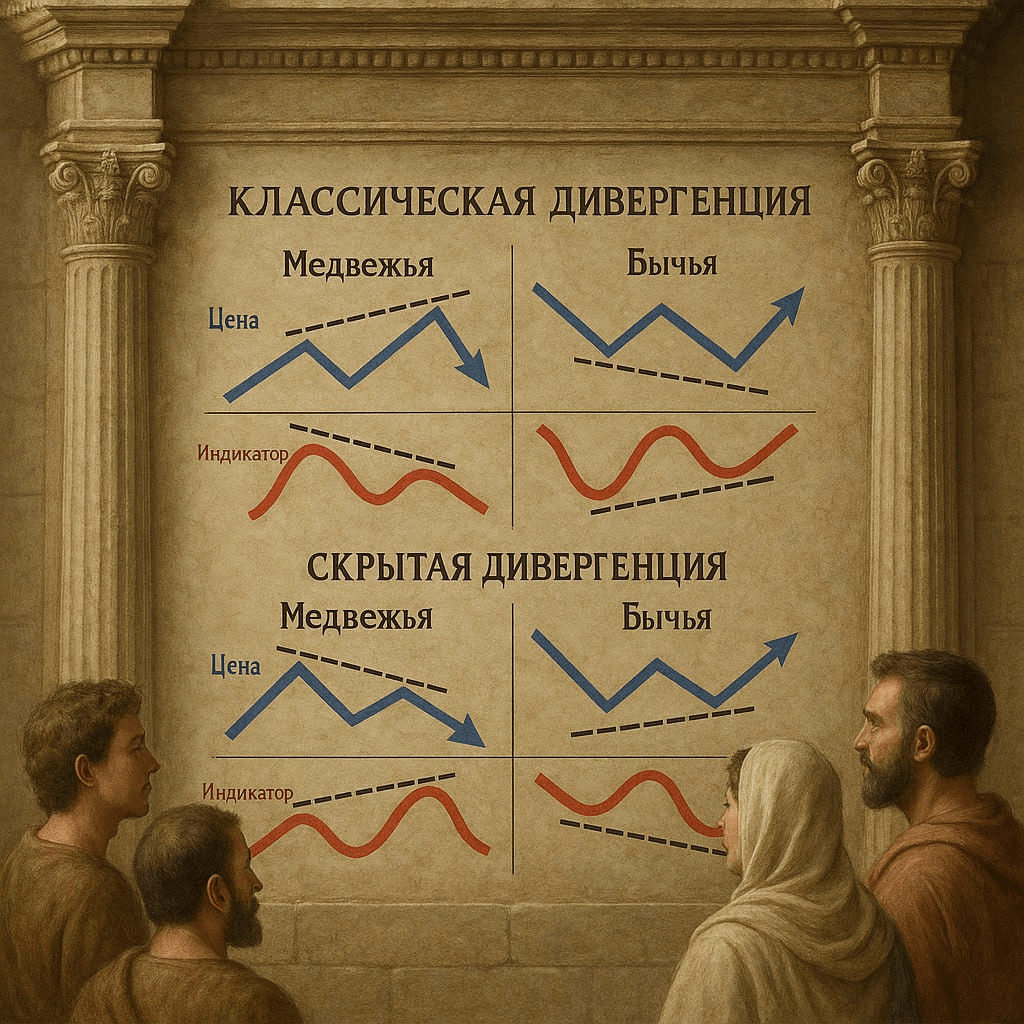
Divergence occurs when the price chart of an asset and the indicator (e.g., MACD, RSI, Stochastic) show different directions🔼🔽. There can be bullish and bearish divergences.
🐂 Bullish divergence:
Occurs when the lows on the price chart decrease while the indicator increases, signaling a possible upward reversal.
🐻 Bearish divergence:
Occurs when the highs on the price chart increase while the indicator decreases, signaling a possible downward reversal.
Regular (reversal) divergence:
⮕ Indicates the likelihood of a change in the current trend.
Hidden (trend continuation) divergence:
⮕ Indicates the likelihood of the current trend continuing.
📌In the case of hidden divergence in a Bullish trend, the lows on the price chart increase while the indicator decreases. In a Bearish trend, the price highs decrease while the indicator increases.
🟠In practice, classic (regular) divergences are one of the best reversal signals💪 (hidden ones are less common). The older the time frame, the stronger the signal, accordingly. In smaller time frames (5-15 min), such patterns often "break".
🀄️Divergence is not a 100% guarantee of a reversal; it is necessary to consider additional confirming signals such as trendline breaks, support/resistance lines, or Fibonacci levels, as well as other factors such as trading volume, news, market context, and sentiment.
😠🙄Trading and analysis are like a puzzle — when all the pieces come together, we form a complete picture that allows us to make a sound trading decision🪙
😬😁🤗

