🔹 Cup and Handle Formation
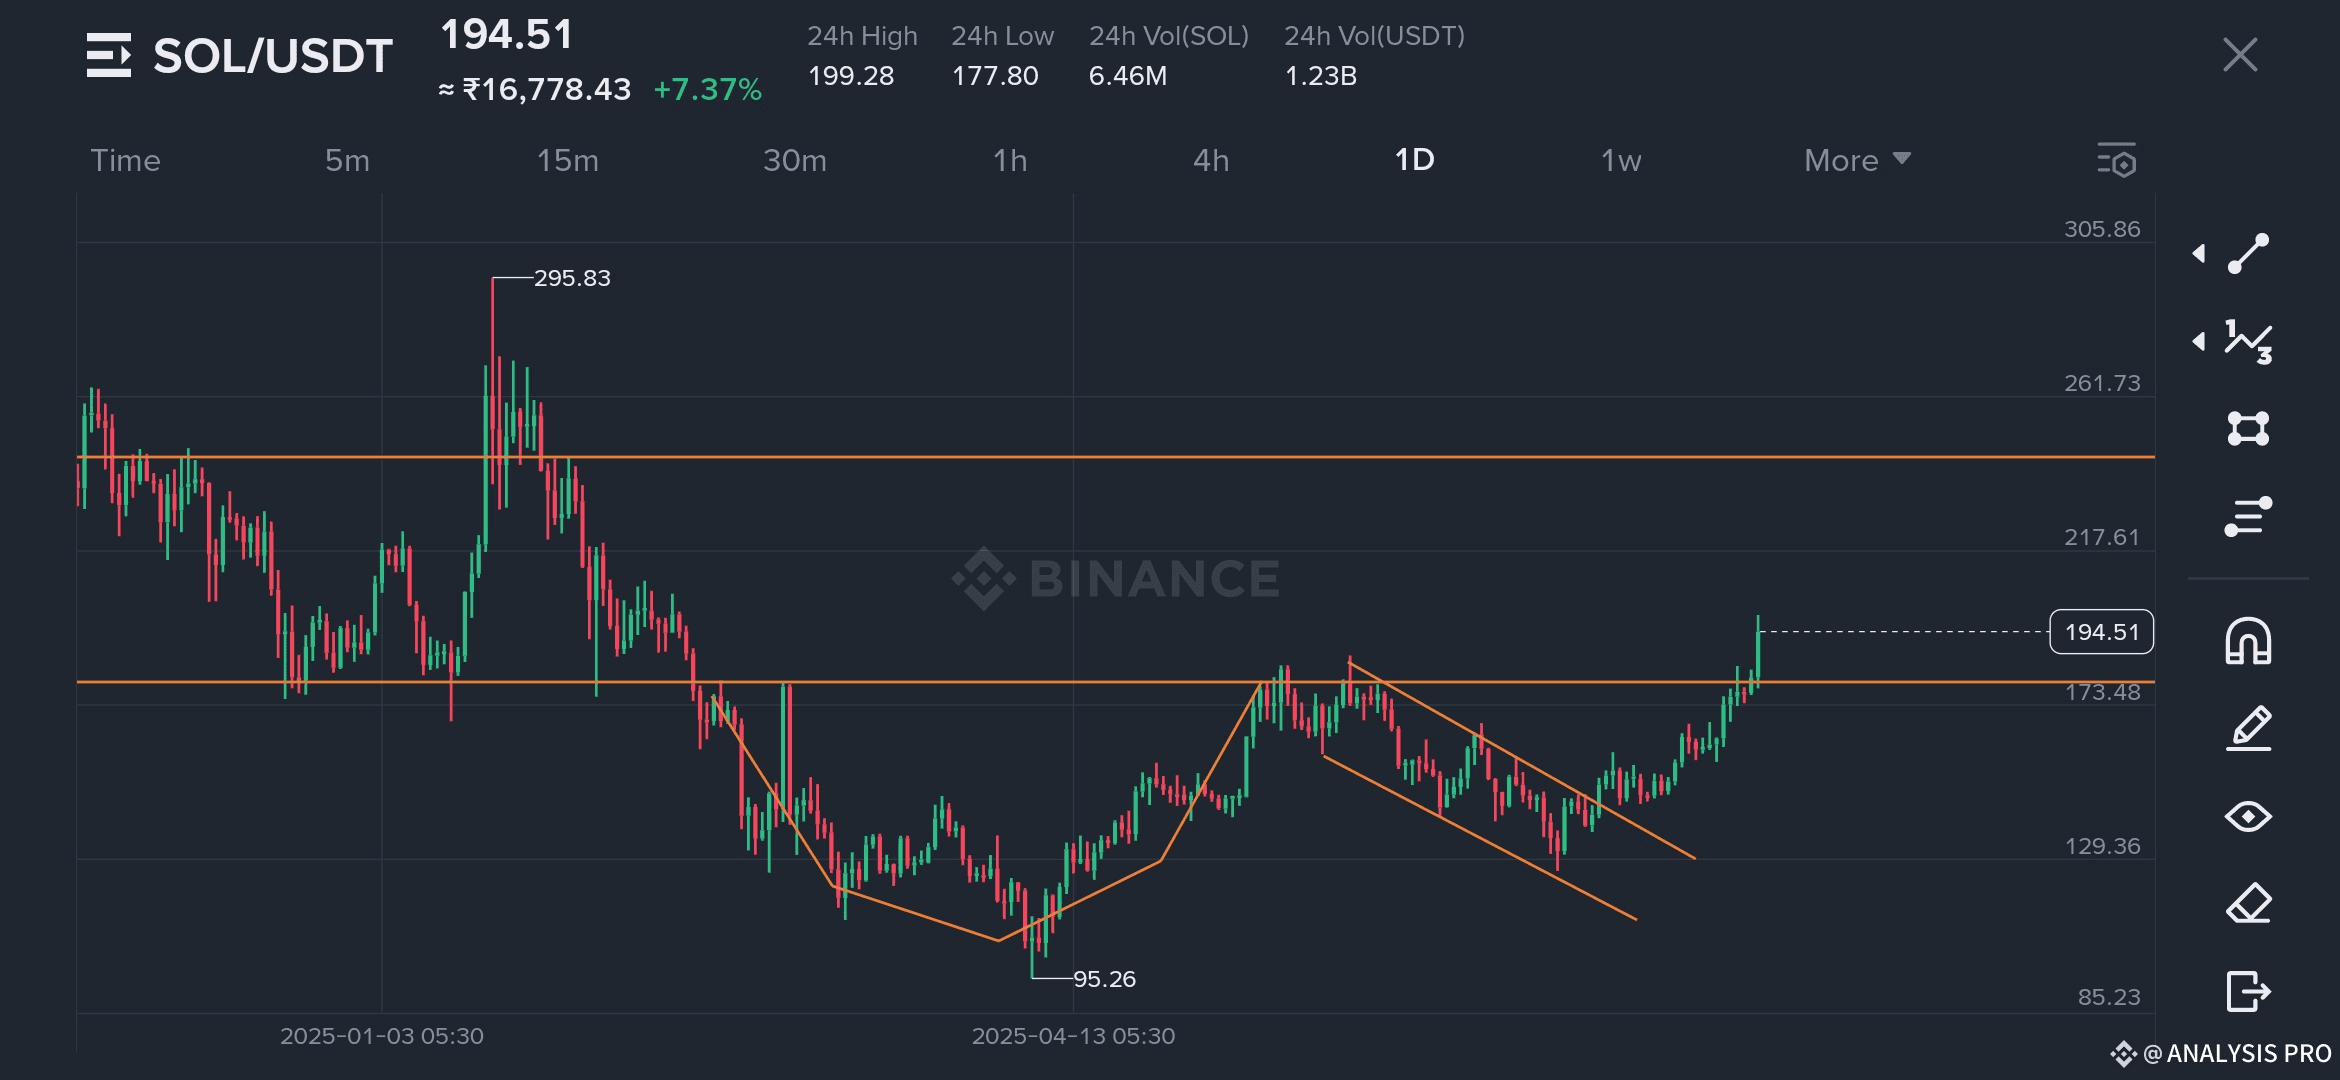
The larger chart pattern also reflects a classic "cup and handle" structure with a bottom around $95.26 and breakout around $173.48. This pattern further supports a bullish outlook, often signaling the start of a longer-term uptrend.
🔹 Key Resistance Zones:
$217.61 – Next major resistance. A break above this could open doors to further upside.
$261.73 – A critical level from previous highs; surpassing this could lead SOL toward retesting its all-time highs near $295.83.
$295.83 – Historical high acting as long-term resistance.
🔹 Key Support Levels:
$173.48 – Recently flipped resistance now acting as immediate support.
$129.36 – Strong support from prior consolidation zone.
$95.26 – Cycle low and base of the recent bullish formation.
Market Sentiment & Outlook:
The price action shows renewed strength, backed by volume and technical breakout signals. Solana’s successful breakout from both the wedge and the cup-and-handle pattern is a strong bullish signal, suggesting increased investor confidence and potential institutional interest.
If SOL maintains above the $173-$180 support area, it may soon attempt to test the $217 and $260 resistance levels. Failure to hold above $173 could lead to a temporary retest of lower support zones.
Conclusion:
Solana (SOL) is exhibiting powerful bullish momentum, with multiple technical indicators aligning to suggest further upside. Traders and investors may watch for continuation signals while managing risk around key support levels. With the broader crypto market also showing signs of strength, SOL remains one of the top altcoins to watch in Q3 2025.
Note: This is not financial advice. Always conduct your own research or consult with a financial advisor before making investment decisions.