Let me tell you a story. When I was at my worst, I lost 5 million in contracts in three days, heavily in debt, almost facing family ruin and contemplating life. But the crypto world is so magical. By chance, I received guidance from a wise person. In the stormy night, I truly understood how to start over and work full-time in trading, becoming a professional trader. I have diligently studied the technology, spending thousands of days and nights researching and learning!
The journey in the crypto world is long; I hope everyone can take fewer detours and avoid more tragedies! As someone who has achieved financial freedom, I continue to create on Zhihu. Many people do not understand why, after achieving financial freedom and reaching several small goals, I still want to do this. I have asked myself the same question. In the process of rediscovering my original intention, on one hand, it's for my heroic dream; I dedicate everything to trading, honing my skills to the utmost and wanting someone to know and witness it! On the other hand, I want to provide a path for those who are eager to learn. What I have gained from the market is also a process of giving back to the market. The way of nature reminds me of the countless struggles I faced for half a year, tortured by the issue of leverage. There was no path to learn from, only the K-line repeating itself over and over, through countless days and nights, struggling to reach where I am now, I deeply understand the difficulties faced by small retail investors in the crypto world and can empathize more!
So how can we do well in trading cryptocurrencies? Once a person enters the financial market, it is very difficult to turn back. If you are currently losing but still confused, and plan to make cryptocurrency trading a second career, you must know the "simplest Bollinger Band indicator strategy." Understanding and mastering it can help you avoid many detours. These are all personal experiences and feelings, and I suggest you save them and contemplate repeatedly!
Methods of Using the Bollinger Band
1. Concept: The Bollinger band (BOLL) is also known as the price channel line, which indicates the trajectory of the coin price operating within a certain range. Technically, it serves as a reference for determining buy and sell points.
2. Principle: The movement of coin prices always fluctuates around a certain value center (such as moving averages, cost lines, etc.) within a certain range. (Understanding the Bollinger band: Coin prices fluctuate up and down around the middle band.)
Three, Composition: The Bollinger band consists of three lines: Upper Band - the yellow line of the Bollinger Line; Middle Band - the white line of the Bollinger Line; Lower Band - the purple line of the Bollinger Line.
Three application methods of the Bollinger band: First is the basic usage, second is the usage of the opening direction of the three lines, and third is the relationship between the K-line and the upper, middle, and lower Bollinger bands.
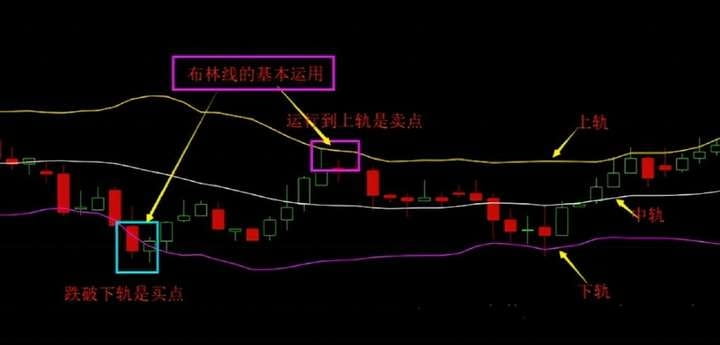
Basic Usage: Generally, the coin price will operate within the Bollinger channel. When the price is near the upper band, it is a strong resistance level and can generally be considered a selling point; when the price is near the lower band, it is a strong support level and can generally be considered a buying point.
The core line of the Bollinger band is the middle band: the middle band is what we call the value center. The upper and lower bands are derived from the middle band. Those who have studied statistics should be able to see from the calculation formula above why the pressure of the upper Bollinger band and the support of the lower band are very effective.
From the calculation formula, we can also see: The longer the period of the Bollinger band, the stronger the pressure of the upper band and the support of the lower band! The daily Bollinger middle band represents the 20-day moving average of the coin price, the weekly Bollinger band represents the 20-week moving average, and the monthly Bollinger band represents the 20-month moving average. How to understand this? 20 months is nearly two years, meaning the cost of holding coins for everyone over the past two years. The support of the monthly Bollinger lower band indicates the maximum decline that holders can tolerate over these two years. The bears need great courage to break this level!
Currently, the BOLL line we use primarily utilizes the 20-day moving average of the coin price as the middle band. As for why, I'm not entirely sure; it is probably the result of practical testing. This indicator can be adjusted as long as it has guiding significance for your operations. It doesn't matter how many days of average line you change it to. Our technical teaching uses the 20-day moving average as the standard Bollinger line.
Five, Usage:
The usage of the Bollinger band is extensive. We mainly discuss a few aspects. Using only the BOLL line as a reference does not have much guiding significance. Combining it with other indicators will yield very good results.
1 Basic Usage
A. Generally, when the price is near the upper band, it is a selling opportunity; when the price is near the lower band, it is a buying opportunity.
B. The price can run along the upper Bollinger band for a long time, but the coin price cannot stay below the lower Bollinger band for long.
C. The longer the period of the Bollinger band, the stronger the pressure of the upper band and the support of the lower band. Monthly Bollinger band > Weekly Bollinger band > Daily Bollinger band.
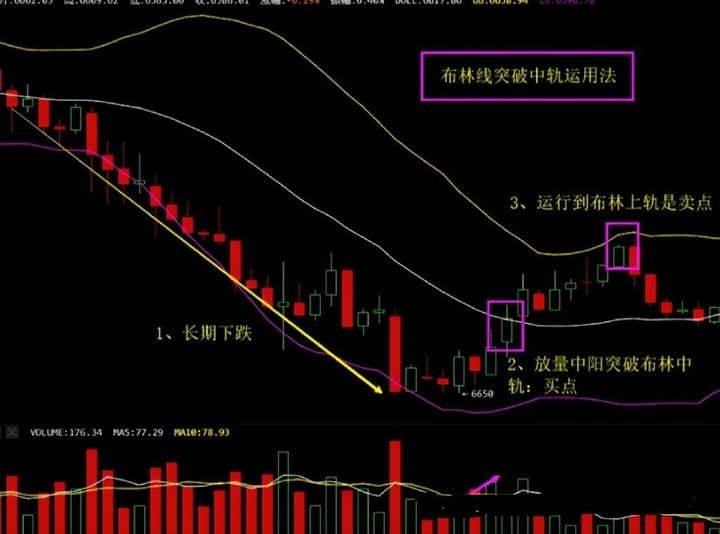
D. Generally speaking, the middle band is the watershed for the strength of price movement. When the price runs above the middle band, it means the price is strong; when the price runs below the middle band, it means the price is relatively weak. If the price has been in a long-term decline and suddenly breaks above the middle band with a large bullish volume, it is a buying point. Similarly, if the price has been rising for a long time and suddenly a large bearish candle breaks down through the middle band, it is a selling point.
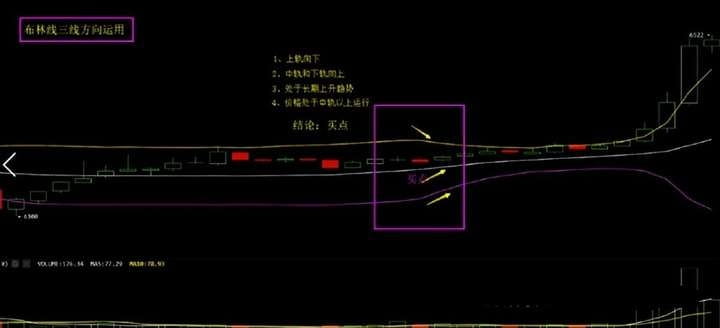
E. General usage of the direction of the opening of the three Bollinger lines:
1. When all three Bollinger lines are moving upward, it indicates that the strong price characteristics are very obvious, and the price will continue to rise in the short term.
2. When all three lines are moving downward simultaneously, it indicates that the weak phase of the price is very obvious, and the short-term price will continue to decline.
3. When the upper Bollinger band is moving downward while the middle and lower bands are still moving upward, it indicates that the price is in a consolidation phase. If the price is in a long-term upward trend, it suggests a strong consolidation during the rise, allowing for entry on dips. If the price is in a long-term downward trend, it indicates a weak consolidation during the decline, focusing on watching and reducing positions.
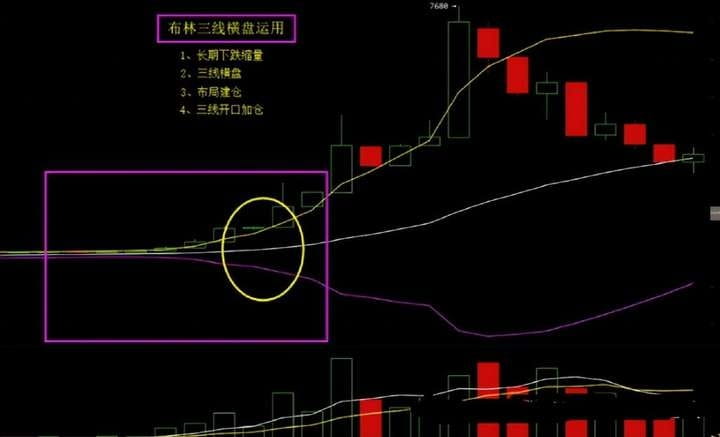
4. When the upper, middle, and lower Bollinger bands are all moving horizontally, it is necessary to determine the current trend of the price.
A. After a long-term decline, horizontal movement indicates that the price is in the process of building a bottom, and one can build positions in batches. Once the three lines begin to diverge, increase positions and buy.
B. When the price has been in a slight upward trend, it indicates that the coin price is in a consolidation phase during the rise, allowing for position increases.
C. When the price is at a high and enters a phase of slight decline with all three lines moving horizontally, it indicates that the price is in a sideways consolidation phase during a downtrend, primarily reducing positions. Once divergence occurs, sell decisively.
F. The relationship between the K-line and the upper, middle, and lower Bollinger lines.
1. When the K-line breaks upward from below the middle Bollinger band, it indicates that the strong price characteristics are beginning to emerge. If the volume effectively expands, it can be a good buying point.
2. When the K-line attempts to break above the upper Bollinger band from above the middle band, it indicates that the strong price characteristics have been established, and the coin price can rise significantly in the short term.
3. When the K-line breaks above the upper Bollinger band, its movement direction continues upward. If the direction of all three Bollinger lines is also upward, it indicates a strong price characteristic, suggesting that there is still room for short-term price increase. Only when the price starts to turn downward should one consider selling coins. This is quite common. Generally, when the price breaks the upper band, it faces significant pressure. If the next day a large bearish candle falls within the upper Bollinger band, it signifies that the price is under great pressure. If the price has risen sharply beforehand, one should decisively exit. The examples make this quite vivid:
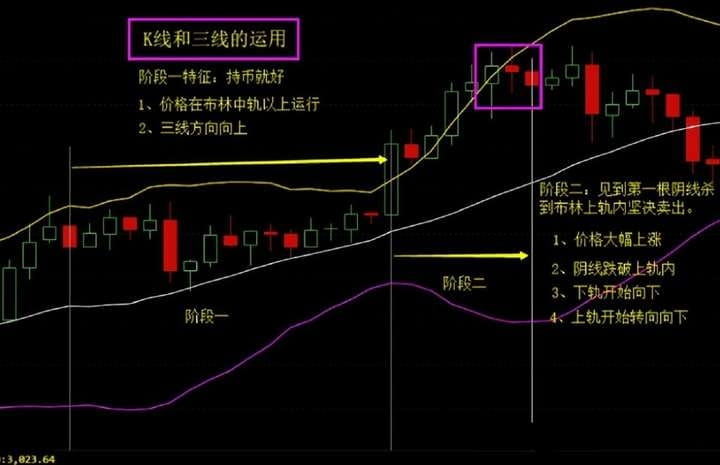
4. If the K-line falls back inside the upper band, and all three lines begin to move downward simultaneously, it indicates that the short-term trend is ending and a significant decline is about to begin, so exit decisively.
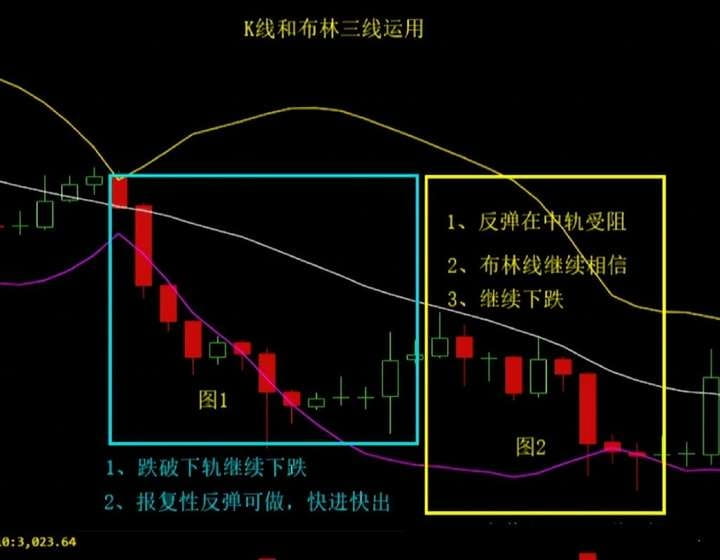
5. When the K-line breaks downward from the upper Bollinger band, it indicates the end of a strong short-term market and the formation of a medium-term downward trend. It is crucial to stop losses in time.
6. When the K-line breaks below the lower Bollinger band and continues downward, it signifies that a retaliatory rebound is imminent, and the rebound will continue to oscillate between the upper and lower bands. However, if the direction of the three lines continues downward, it signifies the beginning of a new round of decline and is only suitable for doing oversold rebounds. If after the retaliatory rebound the direction of the Bollinger lines begins to show a trend reversal, it indicates that a reversal in the market is starting.
7. When the K-line remains above the middle band and moves upward with all bands, it indicates that the price is in a strong upward process. As long as the K-line does not fall below the middle band, continue to hold. Conversely, if the price does not break upward with volume above the middle band, do not intervene decisively.
Finally, I would like to share a set of insights summarized from the crypto world. Learning is understanding!
1. Buy early when prices drop and sell early when prices rise: When you see a significant drop in coin prices, there is no need to panic; this may be a good opportunity to enter. Conversely, when prices rise sharply, be cautious of possible pullbacks and reduce positions accordingly. Grasping market fluctuations is key to achieving stable profits.
2. Capital allocation: Capital allocation is a key factor in determining profitability. It should be reasonably allocated according to one's risk tolerance and market conditions. Pursue higher returns while ensuring safety.
3. Afternoon Strategy: If the coin price continues to rise in the afternoon, do not blindly chase high prices; try to avoid high positions. If there is a sudden drop, first observe the market's reaction and do not rush to bottom fish. Wait for the market to stabilize before making decisions.
4. Stay calm: Market volatility can be severe; emotional management is crucial. Do not panic during morning declines, take appropriate breaks during sideways movements, and remain calm without being swayed by emotions.
5. Follow the trend: When the trend is unclear, do not rush to act. Do not sell when the coin price has not made a new high, do not buy when it has not pulled back, and patiently wait during sideways movements. Do not enter the market easily.
6. Yin-Yang Line Strategy: Choose bearish lines when buying, as this is more prudent; wait for bullish lines to appear before selling to achieve higher returns.
7. Counter-Trend Thinking: Going with the trend is a conventional strategy, but at certain moments, counter-trend operations may also bring opportunities. Only by daring to challenge market rules can one gain more returns.
8. Be patient and wait for opportunities: When the coin price is hovering in a high-low range, do not rush for success. Wait patiently for the market to show a clear trend before taking action for a more secure outcome.
9. Risks after high-level sideways movement: If the coin price suddenly rises after being sideways at a high level, be cautious of pullback risks. In this case, reducing positions or decisively exiting is an effective way to avoid being trapped.
10. Hammer Doji Warning: The hammer doji pattern indicates a market turning point. When encountering this pattern, stay alert, avoid full position operations, and controlling risk is the way to stability.
The above are trading insights gathered from 10 years of cryptocurrency trading experiences. After many ups and downs, these are heartfelt words of enlightenment. I hope they are useful to everyone. A banquet produced by Yan'an must be a fine product. There are beauties in the crypto world, unique and independent. The soul has a way, and the currency has a technique!
No matter how diligent a fisherman is, he will not go out to fish in the stormy season; instead, he will carefully guard his fishing boat. This season will eventually pass, and a sunny day will come! Focus on the sunny days, bestow upon you fish and fishing skills; the door to the crypto world is always open. Only by going with the flow can one have a life of ease. Collect this wisdom and keep it in mind!
