I have been in the cryptocurrency world for 10 years and have seen too many people come and go. Some people do not understand what they are trading for three to five years, while others grasp the essence and start making money in less than six months, achieving stable turnaround!
You might be wondering: how can one become the latter?
Let me say something candid: In the cryptocurrency world, complexity is useless. Those who make money eventually return to one word: 'simplicity.' When you are all in, you must play with skill to achieve profits. Various learning methods, finding mentors, and studying on your own have led me to achieve financial freedom. I have experienced losses, stepped on landmines, and mined with dogs – I have done it all! Today, I will share a trading model I have summarized, which is the moving average strategy! What you learn is the way to enlightenment!
Before discussing the moving average strategy, I have very strict 24 trading rules:
1. Capital allocation: Divide the capital into ten parts to ensure that the risk of a single trade does not exceed one-tenth of the total capital.
2. Set stop-loss: Set the stop-loss point immediately when opening a position to protect investments from adverse market fluctuations.
3. Avoid overtrading: Overtrading violates capital management principles and should be avoided.
4. Protect floating profits: When floating profits exceed three basis points, set a protective stop-loss near the opening price to ensure that the principal is not eroded.
5. Go with the trend: In an uncertain market trend, avoid participating in trades.
6. Observational attitude: In the presence of doubts, choose to observe or exit the market.
7. Choose liquidity: Trade in actively traded stocks, avoiding stocks with insufficient liquidity.
8. Risk diversification: Diversify risk by trading multiple stocks instead of concentrating investments.
9. Order types: Flexibly use market orders and limit orders to adapt to market changes.
10. Reason to hold: Do not casually end the trade unless there is sufficient reason; consider using a trailing stop to protect profits.
11. Profit accumulation: When trading goes smoothly, transfer some profits to a reserve account for future needs.
12. Avoid temptations from positive or negative news: Do not overly trust the news that circulates, which could lead to undermining your own plans.
13. Avoid averaging down: Avoid averaging costs by adding to positions, as this may be one of the biggest mistakes traders can make.
14. Patiently wait: Avoid rushing into the market due to impatience, or leaving the market too early due to lack of patience.
15. Avoid small profits and large losses: In trading, one should avoid ignoring potential large losses for small profits.
16. Stop-loss discipline: Once a stop-loss point is set, it should not be casually canceled unless there is sufficient reason.
17. Reduce trading frequency: Avoid frequently entering and exiting the market, as this may lead to unnecessary trading costs and risks.
18. Trading consistency: The willingness to go long or short should align with the market trend, which is key to profitability.
19. Avoid emotional trading: Do not buy simply because the price seems low, or sell short just because the price is high. Make decisions based on market analysis.
20. Pyramid adding strategy: Increase positions appropriately when the price breaks through resistance or falls below support.
21. Cryptocurrency selection: Choose small-cap stocks when going long, and large-cap stocks when going short.
22. Avoid erroneous hedging: If the cryptocurrency you hold starts to decline, you should stop-loss and exit the market instead of hedging by shorting.
23. Trading plan: Do not casually change the trading plan without sufficient reason.
24. Position management: After continuous profits, do not arbitrarily increase your position; consistent risk management discipline should be maintained.
These valuable pieces of advice are the crystallization of years of practical experience and are worth our careful consideration and strict adherence. I hope these suggestions can help everyone avoid detours in the market and steadily move toward success.
Today's focus is on a trading strategy that is both simple and highly effective – the moving average strategy.
Overview of moving averages: Moving averages, commonly referred to as MA, average out prices over a certain period using statistical analysis methods and then connect the average values over different times to form a single MA. This is a technical indicator used to observe price movement trends. In candlestick charts, they represent the moving averages for 5, 10, 30, 60 days, etc., collectively referred to as the moving average system.
However, these are not fixed; they will change based on different settings.
Open the settings panel, and the MA moving average interface will appear, showing parameters for MA1, MA2, MA3, MA4, etc. You can modify them as needed. MA5 indicates the 5-day moving average, meaning the average closing price over the last 5 days, and so on.
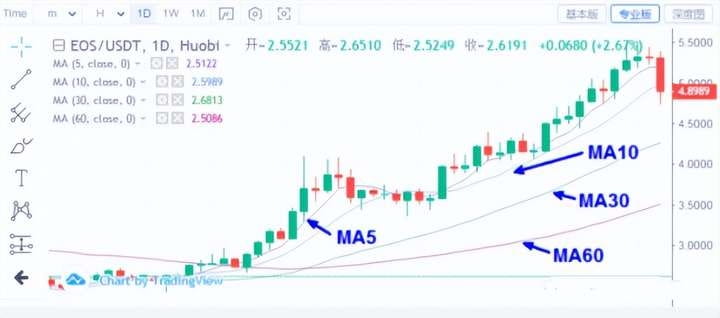
The above chart shows the distribution of moving averages on the candlestick chart.
The role of moving averages.
1. Assist in observing the direction of price movement: By observing the moving average, we can judge the price trend based on the direction of the moving average, whether it is an 'upward trend' or a 'downward trend.'
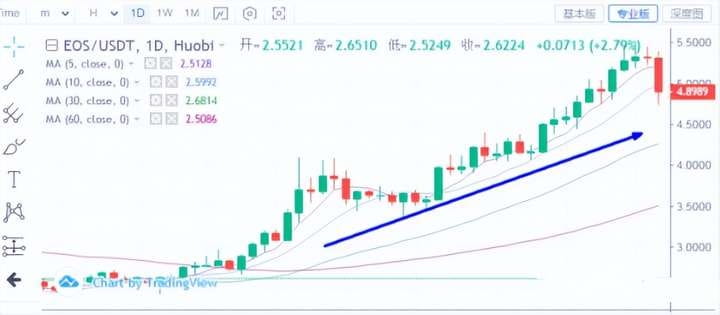
The above chart is a segment of the EOS candlestick chart, where the moving averages are moving upward, indicating an upward trend.
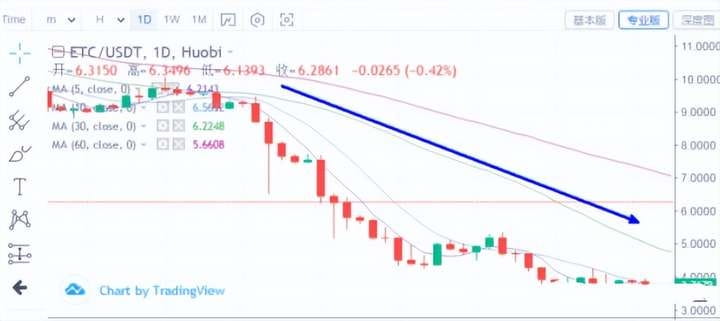
The above chart is a segment of the ETC candlestick chart, where the moving averages are moving downward, indicating a downward trend.
2. Remind the current market's average price.
By observing the relationship between the moving averages and prices, one can remind oneself of the current average cost price in the market or the profit and loss situation over a certain period.
3. Play a role in assisting both rises and falls.
(1) The formation of a bullish arrangement of moving averages is a sign of a bullish market, where the price is continuously supported upward by the moving averages. At this time, we can consider the moving averages as support lines for the price or as a defensive line for bulls. When the price retraces and touches the key moving averages, it usually receives effective support, which can even become an opportunity to buy during the upward movement.
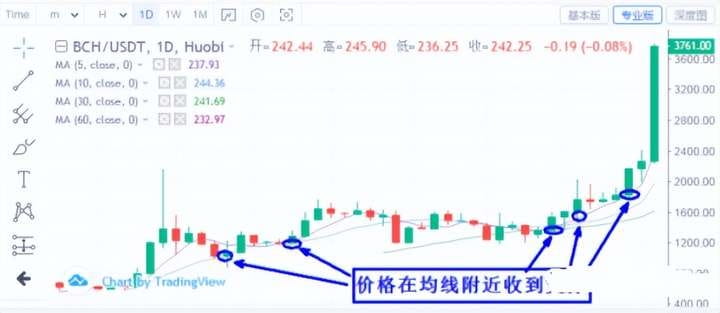
The above chart is a BCH candlestick chart from November to December 2017. Whenever the price retraces to the moving average nearby, it receives support from the moving average, providing a good entry point.
(2) The moving average continuously presses down on the price. At this time, the moving average forms a bearish defense line. If the stock price slightly rebounds and touches the key moving average, it will face significant selling pressure, and the price will quickly revert, continuing to decline. Therefore, based on the supporting role of moving averages in downturns, every time the stock price rebounds and touches the key moving average, it can be considered a short-selling opportunity.
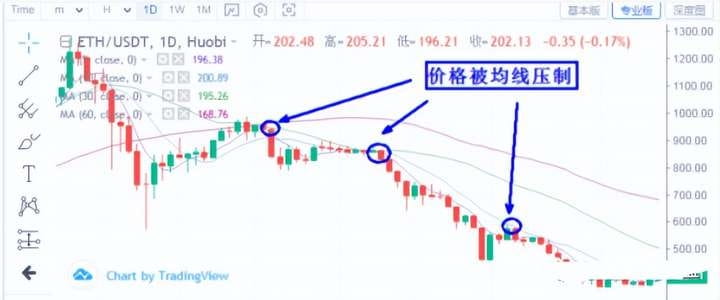
The above chart is a trend chart of ETH from February to April 2018, where it can be clearly seen that after the price breaks below the moving average, each time it rises near the moving average, it is suppressed by the moving average, and the price starts to fall again, continuing in a downward trend.
Advantages and disadvantages of moving averages:
What are the advantages of moving averages? Investors can use moving averages to determine sell or buy signals. When the price effectively breaks below the moving average, it is a sell signal; when the price effectively breaks above the moving average, it is a buy signal. Moving averages can quickly and simply reflect the overall trend of price fluctuations. When the market trend continues, the profits from trading are very good.
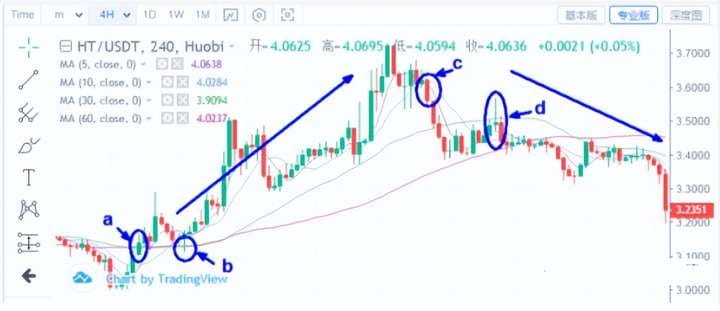
In the chart, point a breaks the moving average, and after a period of increase, it begins to retrace to point b where the break occurred, followed by another period of increase. At point c, it breaks below the moving average, resulting in a price drop. At point d, after pulling back below the break at c, the price continues to decline.
What are the disadvantages of moving averages? If the market is in a consolidation phase, moving averages will frequently reflect buy or sell signals, but most of these signals are incorrect, making it very difficult to determine accurate buying or selling timing. Therefore, relying solely on moving averages for trading is inaccurate; moving averages need to be evaluated in conjunction with other technical indicators.
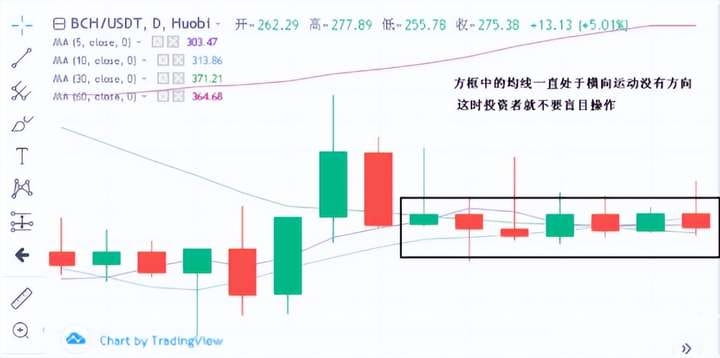
In the chart, several moving averages are intertwined, and at this time, investors can only wait until the final result of the battle between bulls and bears is determined before entering the market; otherwise, it is impossible to grasp the timing for buying or selling.
What are the characteristics of moving averages?
Track trends: By finding upward or downward trend lines in the chart, the moving average can maintain a consistent trend with the trend line, thus eliminating price fluctuations that occur during this process. The moving average can reflect the price trend.
In the chart, several moving averages are consistently moving upward, and the price is also rising. The price moving averages are operating synchronously.
This chart is exactly the opposite, with several moving averages consistently moving downward, and the price is also following the moving averages downward.
Lagging characteristic: Due to the trend-tracking nature of moving averages, their actions are often slow, and the speed of reversal is also lagging. By the time the moving average signals a reversal, the price has already reversed significantly.
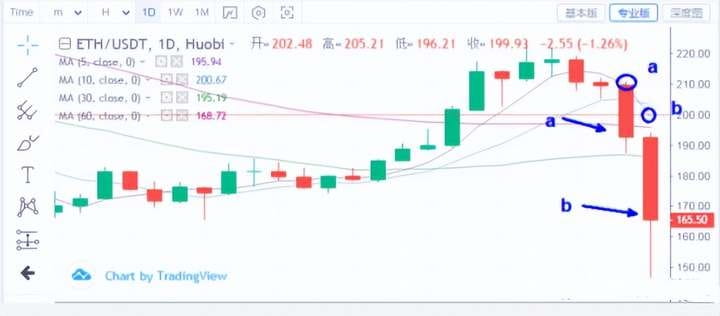
In the above chart, points a and b are ETH's candlestick charts for September 24 and 25, 2019. Point a is the closing price on the 24th at 192.66, and the 5-day moving average is 209.52. Point b is the closing price on the 25th at 165.50, and the 5-day moving average is 199.22. The closing price has already dropped by 27.16 points, while the 5-day moving average has only dropped by 10.30 points, indicating that moving averages have significant lagging characteristics.
Stability: Generally, the longer the period of the moving average, the stronger its stability characteristics. This means that moving averages do not easily rise or fall. They will only extend upward if the price trend is very evident; if one wants the moving average value to fluctuate significantly, the price during that period needs to change dramatically. Thus, moving averages also exhibit delayed response characteristics, and it is essential to grasp the proper balance when using them.
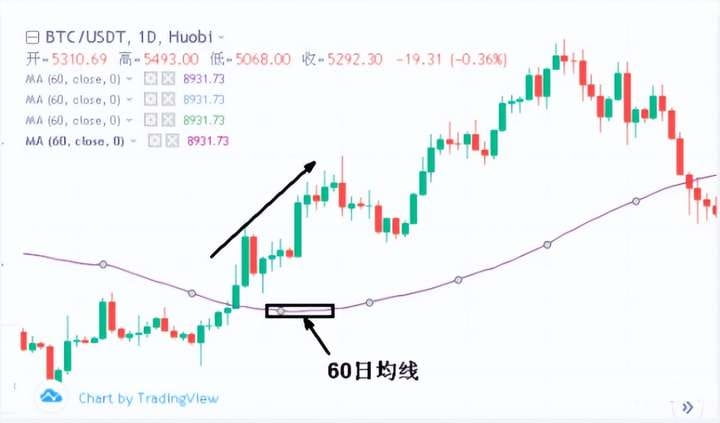
In the chart, the 60-day moving average in the box has not moved much, while the price has already risen significantly. When operating short-term, the reference significance of this longer-period moving average is not substantial, and only short-term moving averages can be used to grasp price fluctuations.
The trend of moving averages.
The moving average trend only has three situations: upward trend, downward trend, and sideways consolidation.
In candlestick charts, due to different cycles, there will be ultra-short trends, short-term trends, and medium- to long-term trends. Investors can observe the direction of MA5, MA10, MA30, MA60, etc., to discern trends.
Upward trend: This is when the price's lows are continuously rising, and the highs are also continuously moving upward. At this time, the moving averages will be arranged upward in a bullish manner.
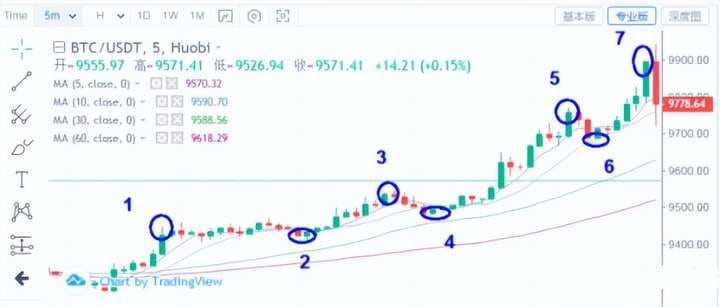
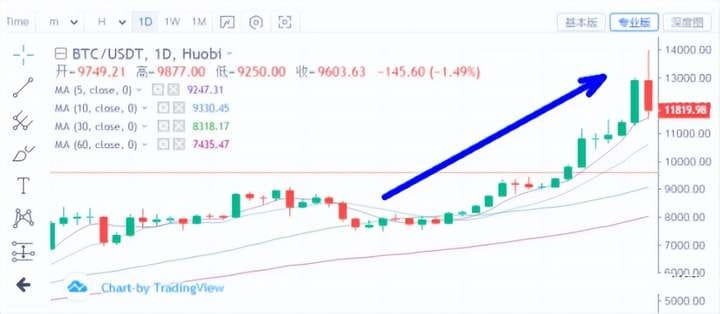
The above chart is a 5-minute BTC chart showing a rising trend. In the chart, the highs at 1, 3, 5, and 7 are continuously rising, and the lows at 2, 4, and 6 are also consistently increasing. This operational trend indicates an upward trend. Since this candlestick chart is based on 5 minutes, it can also be understood as a super short-term upward trend.
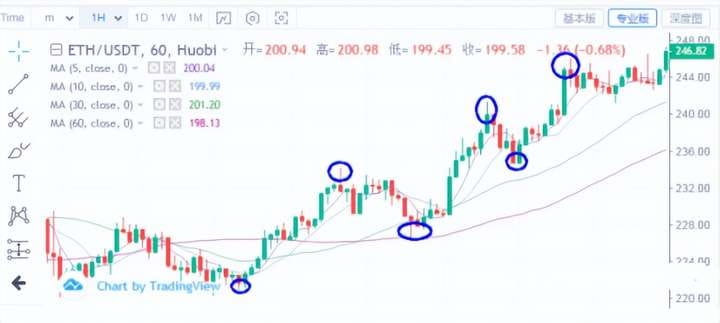
The points marked in the chart also show that the highs are continuously rising, and the lows are also continuously rising, indicating an upward trend. Since the cycle of this chart is a 1-hour candlestick chart, which is longer than the 5-minute cycle chart, the trend sizes will also differ, which can be understood as a short-term upward trend.
Downward trend: This is when the highs are continuously moving down, and the lows are also continuously moving down, overall showing a downward operational trend. At this time, the moving averages will be arranged downward in a bearish manner.
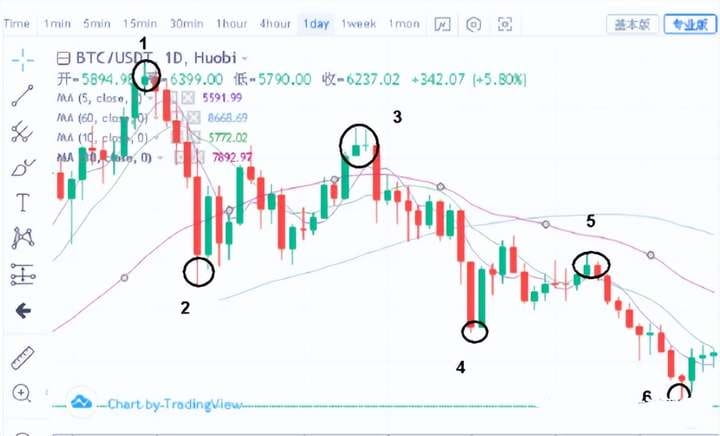
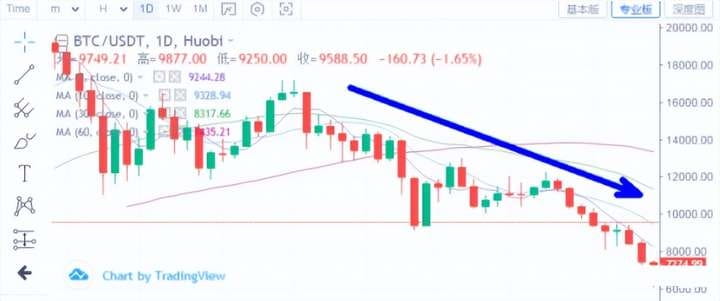
The above chart is the daily candlestick chart of Bitcoin. In the chart, you can see that the highs at 1, 3, and 5 are moving down, and the lows at 2, 4, and 6 are also continuously moving down, indicating a downward trend.
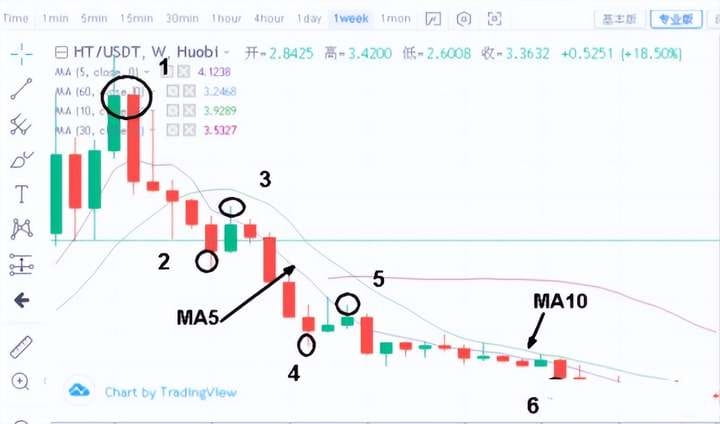
This is the HT weekly candlestick chart, where the lows at 2, 4, 6 are continuously moving down, and the highs at 1, 3, 5 are also continuously moving down. The MA5 and MA10 moving averages are also in a downward trend. This candlestick chart is a weekly chart, so it can be understood as a medium-term downward trend. For long-term trends, one can refer to monthly cycle charts for analysis.
Sideways consolidation: This is when the highs are almost at the same level and the lows are also at the same level, commonly known as box consolidation.
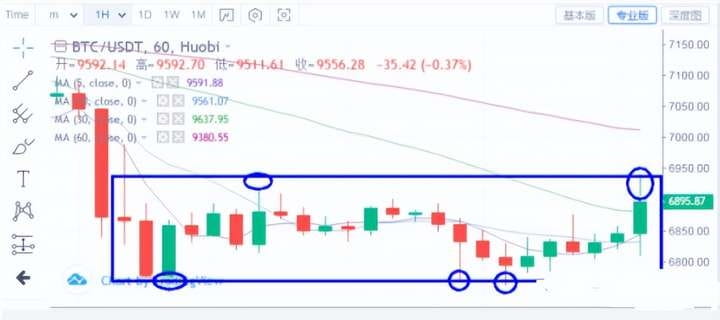
The above chart is a BTC 30-minute candlestick chart. The highs are almost all around the same position, and the lows also retrace around the same position. The moving averages are also moving horizontally, indicating a sideways consolidation market.
Due to the varying cycles of candlestick charts, there are also differences in trends, but large cycles determine small cycles. Before the large cycle trend changes, the small cycle basically follows the movement of the large cycle, providing investors with a good reference.
The above are Yan An's personal views and insights. If you find them helpful, you can like and bookmark them. I am Yan An, someone who has experienced three bull and bear cycles, adept at logical coin selection and technical timing, engaging only in trades within my understanding. Every direction has been validated by the market!
No matter how diligent a fisherman is, he will not go out to fish during a stormy season. Instead, he will carefully guard his fishing boat. This season will eventually pass, and a sunny day will come! Follow Yan An, who teaches you both to fish and how to fish. The cryptocurrency world is always open. Only by going with the trend can you have a life in harmony with the trend. Keep it close and remember it in your heart!