
🔍 Complete Technical Analysis & Market Insight
After months of downward pressure, XAI/USDT is finally showing significant signs of life. The pair has successfully broken out of a long-standing descending trendline that has capped price action since November 2024 — potentially marking the beginning of a new bullish phase.
📐 1. Pattern & Technical Structure:
🔸 Descending Trendline Breakout:
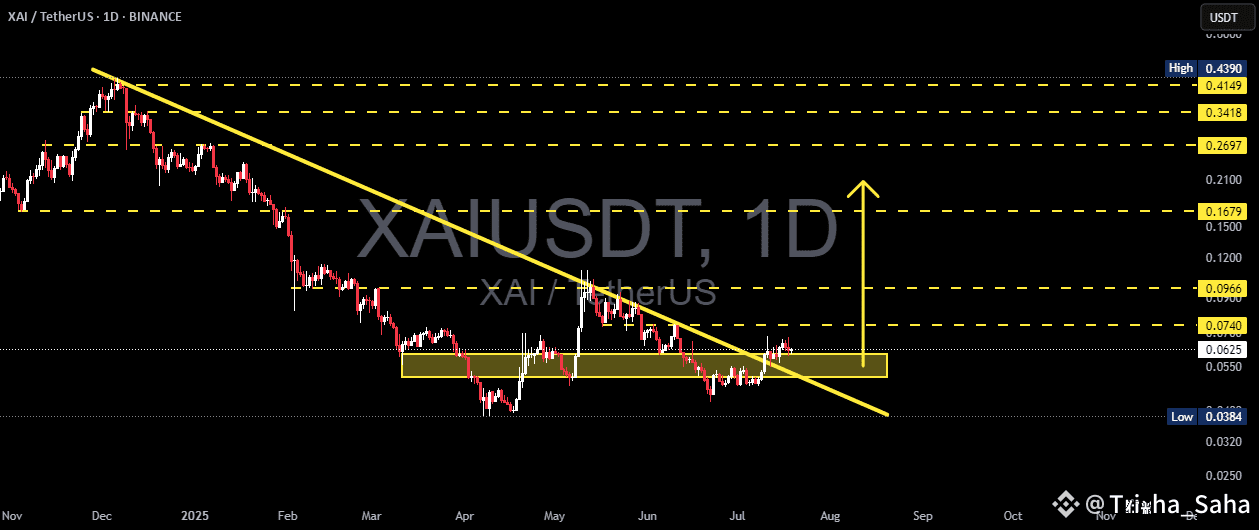
Price has broken above the descending trendline, ending a multi-month bearish phase.
The breakout is supported by bullish candles and an uptick in volume, suggesting momentum shift in favor of the bulls.
🔸 Strong Accumulation Zone (Demand Area):
The area between $0.0550 – $0.0740 has acted as a solid accumulation/support zone.
Multiple rejections and consolidations around this zone suggest aggressive buyer interest.
🔸 Higher Low Formation & Potential Reversal Structure:
A series of higher lows is forming, indicating a potential bullish trend reversal.
The price structure hints at the possible development of a larger bullish pattern, such as an inverse head and shoulders or base formation.
📈 Bullish Scenario:
If the breakout holds and the price sustains above the key support:
Short-term target:
$0.0966 – initial resistance and psychological level.
Mid-term targets:
$0.1679 – strong historical resistance.
$0.2697 – a major reaction zone from previous breakdowns.
Long-term target if momentum continues:
$0.3418 – $0.4390
⚠️ Confirmation with volume and follow-through candles is crucial to validate a sustained bullish move.
📉 Bearish Scenario:
If the price fails to maintain above the breakout zone:
It may retest the accumulation zone between $0.0740 – $0.0624.
A breakdown below $0.0550 would invalidate the bullish thesis and could lead back to the previous low at $0.0384.
Breaching below $0.0384 could trigger a renewed bearish continuation.
📊 Market Sentiment & Context:
XAI is at a technically significant point. With selling pressure weakening and early bullish structures emerging, XAI could be positioning for a strong upside move — especially if broader market conditions improve.
However, given the speculative nature of the current breakout, risk management remains essential. False breakouts are not uncommon, especially in altcoins.
🧭 Strategic Summary:
Potential Buy Zone (on retest): $0.0624 – $0.0740
Stop Loss (conservative): Below $0.0550
Take Profit targets:
Short-Term: $0.0966
Mid-Term: $0.1679 – $0.2697
Long-Term: $0.3418 – $0.4390
Big breakouts often begin with subtle but critical structural shifts. XAI is showing early signs of such a shift — it could be the calm before a bullish storm, or just a trap. Either way, it deserves your close attention.
#XAIUSDT #XAI #AltcoinBreakout #CryptoBreakout #TrendReversal
