1. Moving Average (MA): A trend-following indicator that smooths out price data by creating a constantly updated average price.
2. Exponential Moving Average (EMA): Similar to the MA, but gives more weight to recent prices, making it more responsive to recent price changes.
3. Simple Moving Average (SMA): An average of prices over a specified period, giving equal weight to each price point.
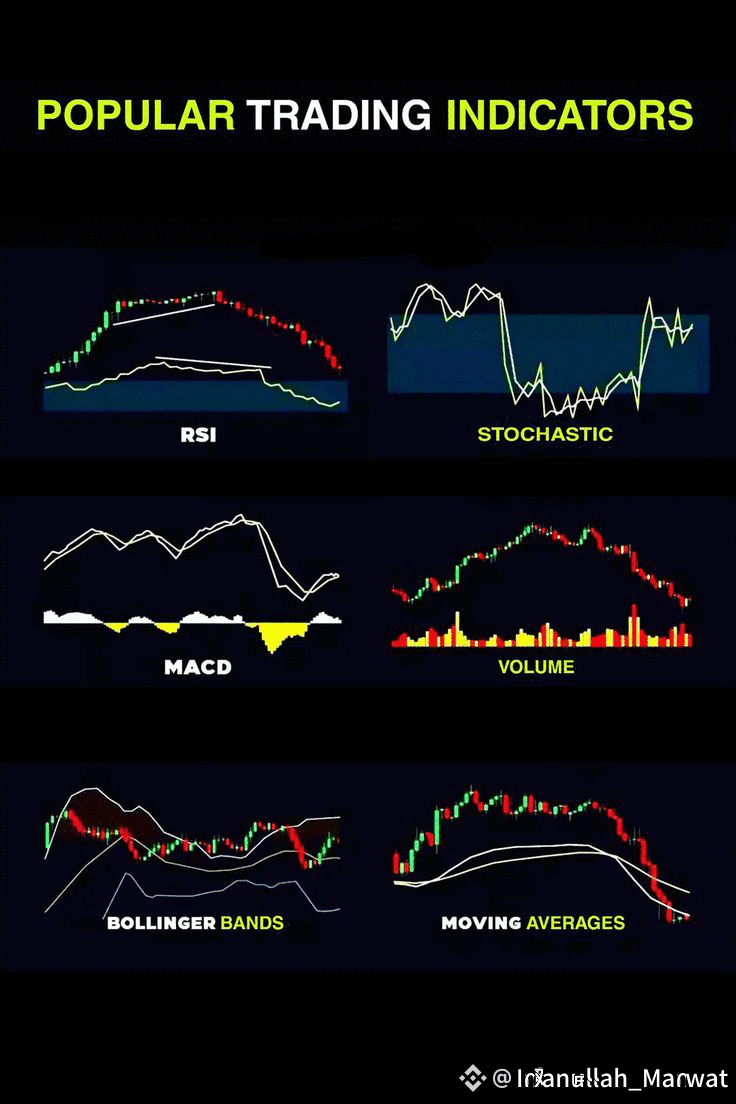
4. Relative Strength Index (RSI): A momentum oscillator that measures the speed and change of price movements, typically used to identify overbought or oversold conditions.
5. Moving Average Convergence Divergence (MACD): A trend-following momentum indicator that shows the relationship between two moving averages of a security’s price.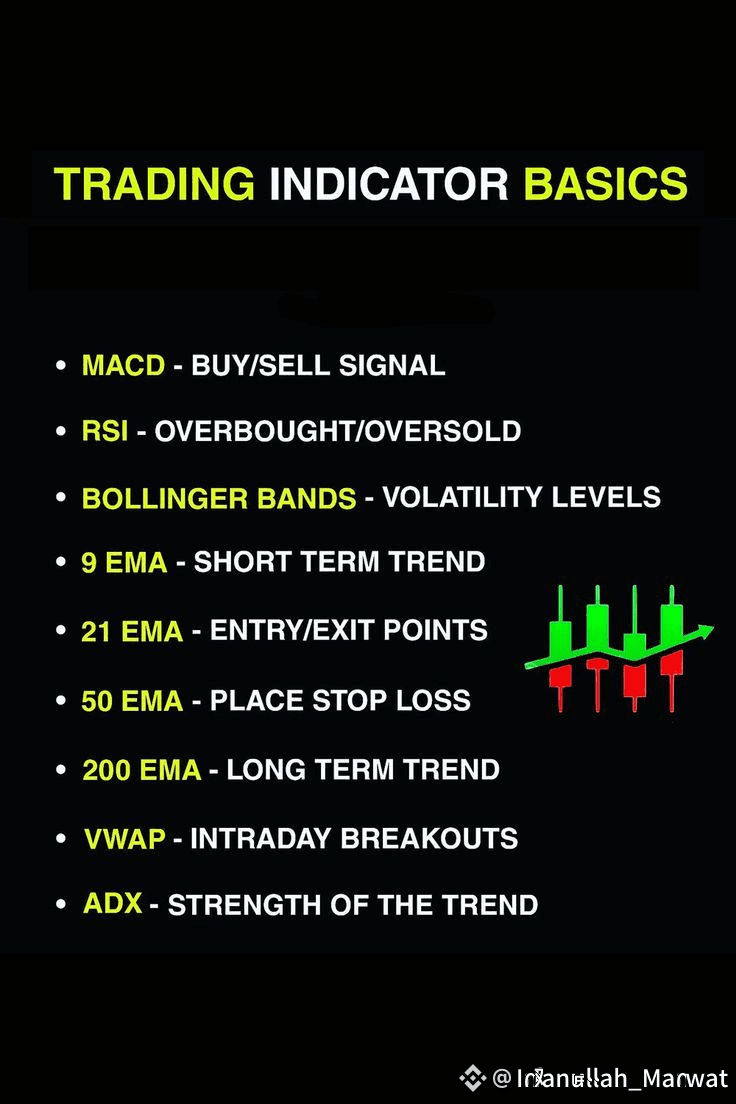
6. Bollinger Bands: A volatility indicator that consists of a middle band (SMA) and two outer bands representing standard deviations above and below the SMA.
7. Stochastic Oscillator: A momentum indicator that compares a particular closing price to a range of its prices over a certain period.
8. Fibonacci Retracement: A tool used to identify potential support and resistance levels based on the Fibonacci sequence.
9. Volume: Measures the number of shares or contracts traded in a security or market during a given time period.
10. Average True Range (ATR): A volatility indicator that shows the average range of price movement over a specific time period.
11. Parabolic SAR (Stop and Reverse): A trend-following indicator used to identify potential price reversals.
12. Ichimoku Cloud: A collection of indicators that provide information about support, resistance, trend direction, and momentum.
13. On-Balance Volume (OBV): A volume-based indicator that uses volume flow to predict changes in stock price.
14. Williams %R: A momentum indicator that shows overbought and oversold levels, similar to RSI but on an inverted scale.
15. Accumulation/Distribution Line (A/D Line): A volume-based indicator that measures the cumulative flow of money into or out of a security.
16. Pivot Points: Price levels used by traders to predict potential support and resistance levels for the day.
17. Envelope: A moving average with two bands placed above and below it at a set percentage distance, used to identify overbought and oversold conditions.
18. Donchian Channels: A trend-following indicator that plots the highest high and lowest low over a set period, used to identify breakouts.
19. Chaikin Money Flow (CMF): A volume-weighted average of accumulation and distribution over a specific period, used to confirm trends.
20. TRIX (Triple Exponential Average): A momentum indicator that shows the rate of change of a triple exponentially smoothed moving average.$BNB $ETH $SOL