In the cryptocurrency market, using candlestick charts to determine entry timing is an important technique in technical analysis. Below are some methods for judging entry timing based on candlestick charts:
1. Identify Trends
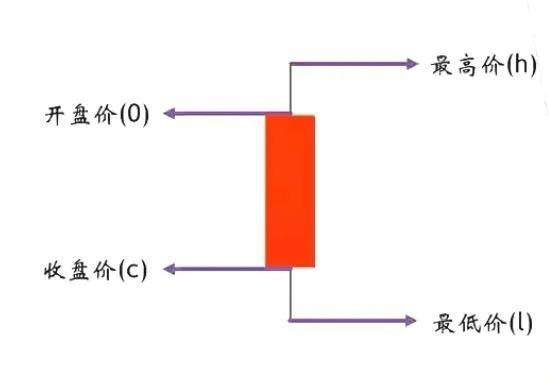
• Upward Trend: If multiple bullish candles (green) appear consecutively on the candlestick chart, and each bullish candle's closing price is higher than the previous one, it indicates that the market is in an upward trend.
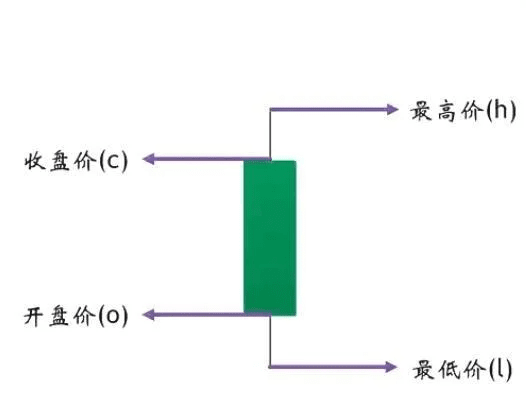
• Downward Trend: If multiple bearish candles (red) appear consecutively, and each bearish candle's closing price is lower than the previous one, it indicates that the market is in a downward trend.
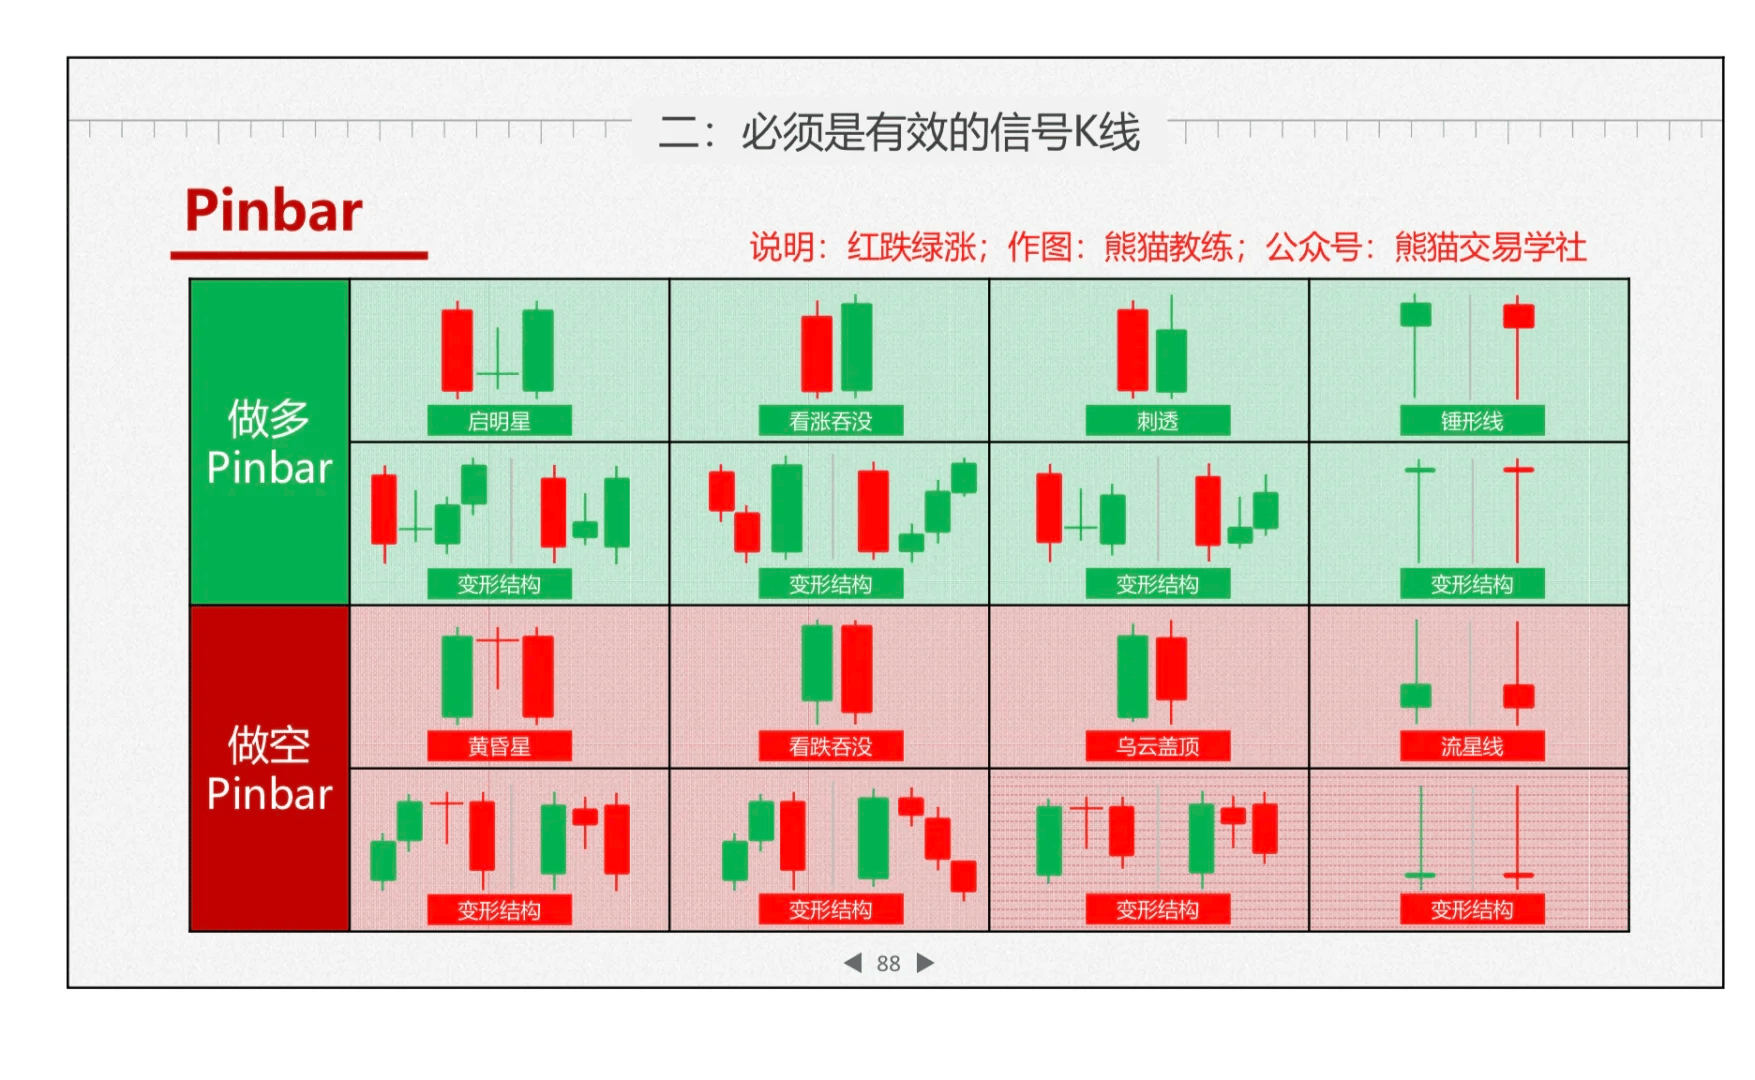
• Trend Reversal Signals: Certain specific candlestick patterns such as hammer, inverted hammer, morning star, engulfing patterns, etc., typically appear during trend reversals and can serve as entry signals.
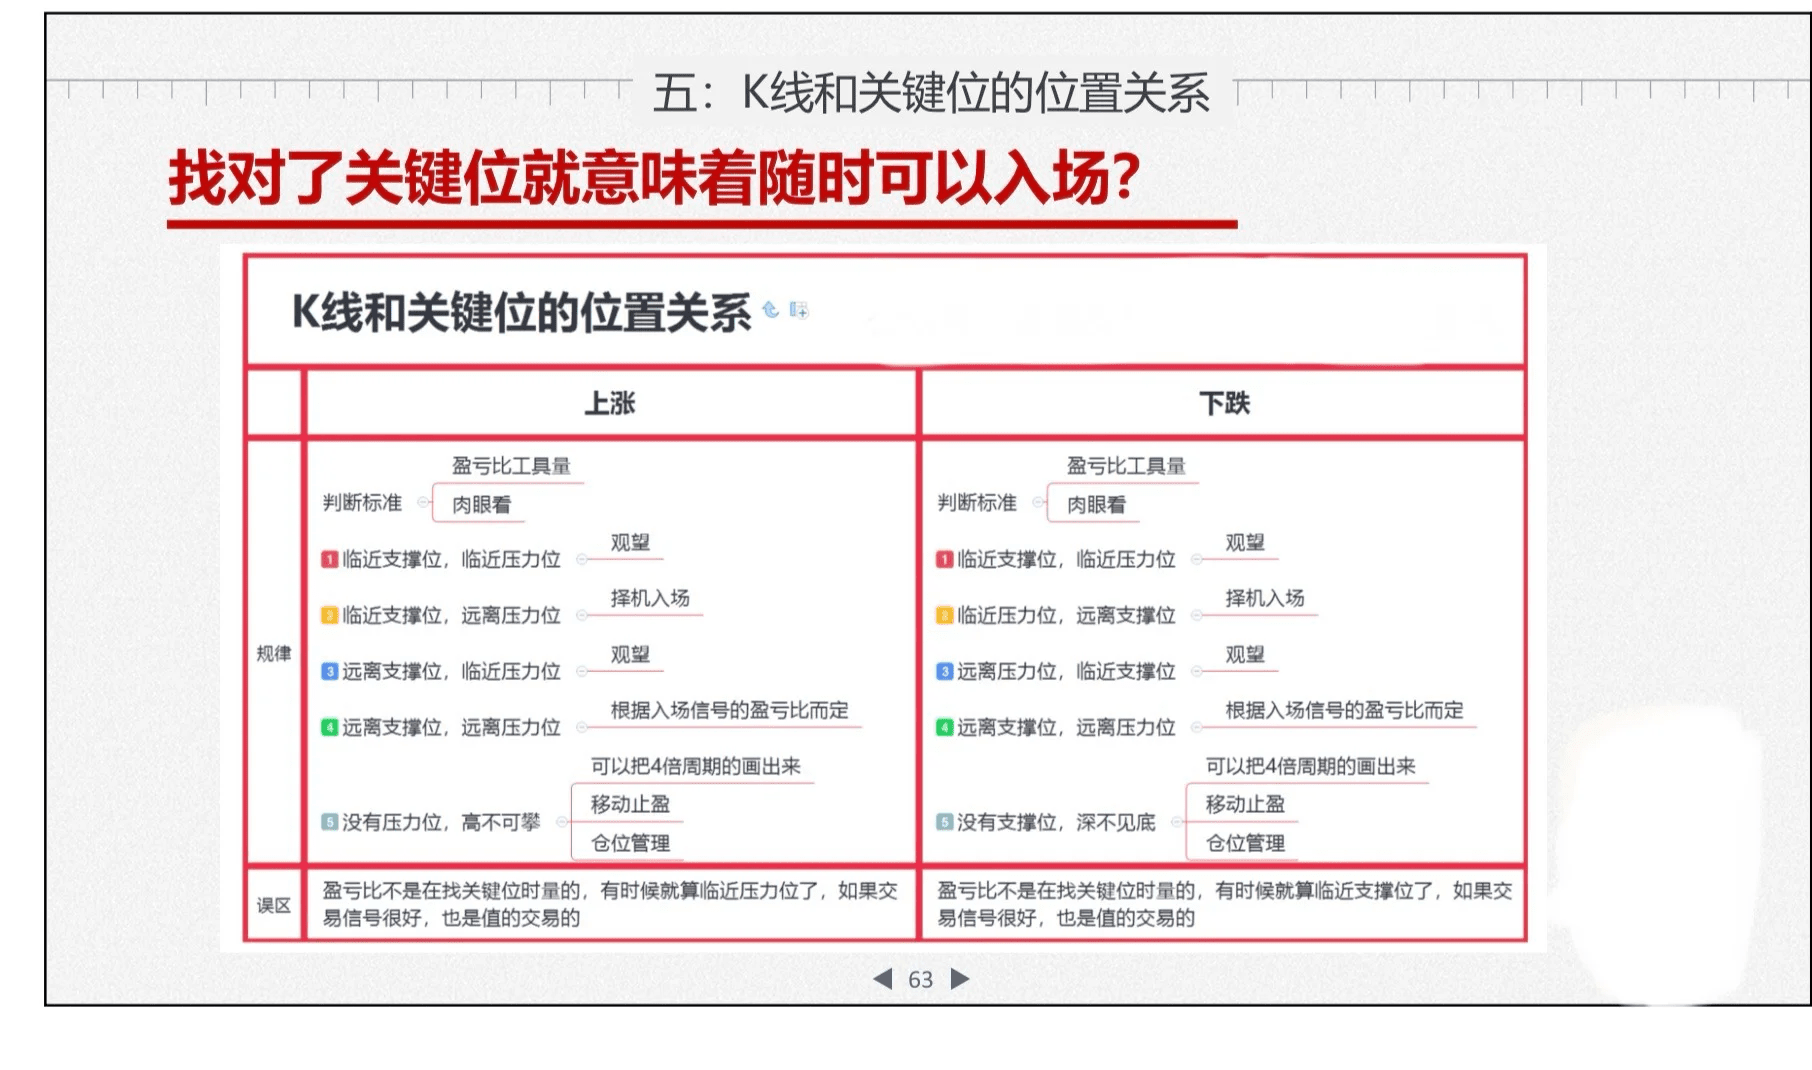
2. Pay Attention to Support and Resistance Levels
• Support Level: When the price falls to a certain range and bounces back multiple times, that range is considered a support level. If the price approaches the support level and a bullish candlestick pattern (like a hammer) appears, it may be a good time to enter a long position.
• Resistance Level: When the price rises to a certain range and retreats multiple times, that range is considered a resistance level. If the price approaches the resistance level and a bearish candlestick pattern (like a hanging man) appears, it may be a good time to enter a short position.
3. Volume-Price Coordination
• Volume-Price Coordination in an Upward Trend: If the price rises while the trading volume also increases simultaneously, it indicates strong buying power in the market, and one may consider entering a long position at this time.
• Volume-Price Coordination in a Downward Trend: If the price declines while the trading volume increases, it indicates strong selling pressure in the market, and one may consider entering a short position at this time.
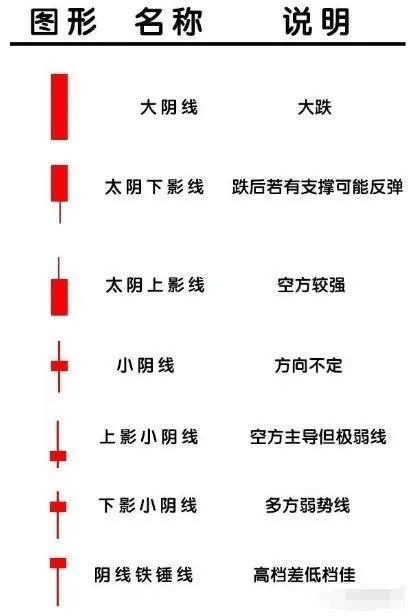
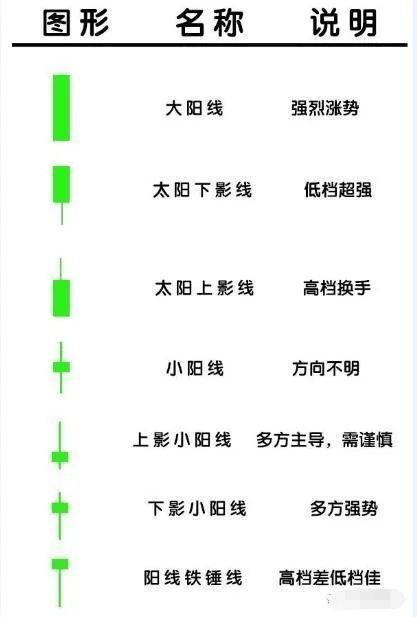
4. Special Candlestick Patterns
• Hammer: Appears at the bottom of a downward trend, with a long lower shadow that is at least twice the length of the body, indicating that the market may reverse upwards, serving as a signal to enter a long position.
• Inverted Hammer: The shape is similar to a hammer, but the shadow is on the upper side, indicating that the market may reverse upwards, suitable for entering a long position.
• Three White Soldiers: Composed of three consecutive bullish candles, each closing price is higher than the previous candle's high price, indicating a strong upward market, suitable for entering a long position.
• Bullish Engulfing: A longer bearish candle is followed by a shorter bullish candle, and the bullish candle is completely within the body of the bearish candle, indicating that the downward trend may be ending, suitable for entering a long position.
5. Combine with Technical Indicators
• Moving Average Crossover: When a short-term moving average (like the 5-day moving average) crosses above a long-term moving average (like the 10-day moving average), it forms a golden cross, indicating that the market may enter an upward trend, serving as a signal to enter a long position.
• MACD Indicator: When the short-term MACD line crosses above the long-term MACD line, it forms a golden cross, indicating that the bullish trend in the market is strengthening, suitable for entering a long position.
6. Risk Management
• Set Stop Loss: When entering a position, it is advisable to set a stop loss point to control risk. The stop-loss point can be set outside key support or resistance levels.