🔍 Technical analysis for Bitcoin (BTC/USDT)
📊 Time frame: 4 hours
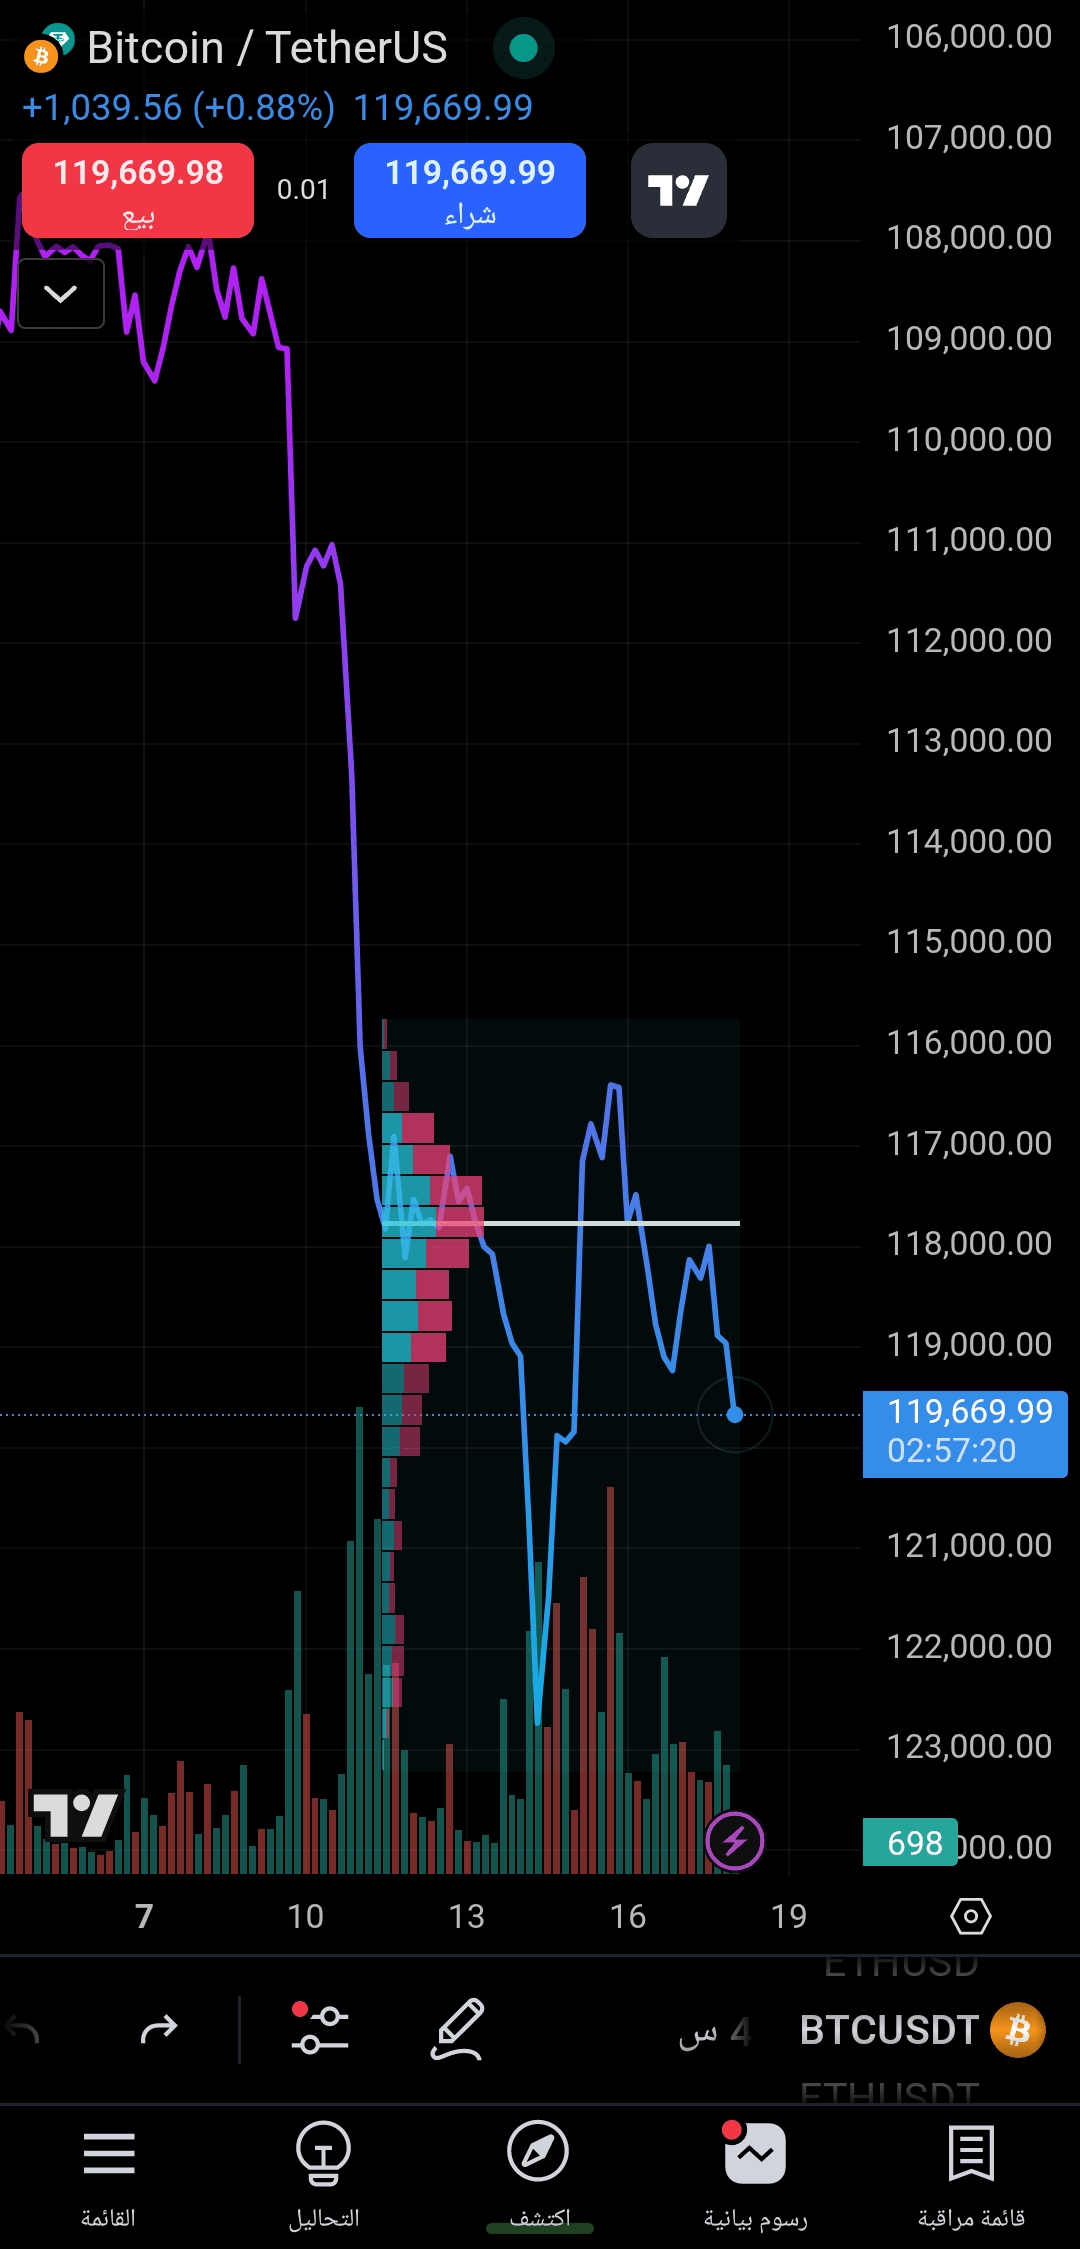
💰 Current price: 119,669 USDT
---
✳️ Technical points and professional analysis:
1. 📉 Sharp drop followed by limited rebound:
The currency witnessed a strong break below the 113,000 level after a sudden selling pressure, showing liquidation of positions or a strong support break.
The subsequent rebound came with clear volatility between 116,000 and 118,500 with failed attempts to breach this resistance.
2. 📊 Volume Profile Indicator:
The largest liquidity cluster (POC) is at the 118,000 level, indicating a price equilibrium point and fierce battle between buyers and sellers.
Any break above 118,500 could ignite a new buying wave 🔥.
3. 🔻 Decrease in liquidity with every rise:
The decline in trading volume during upward attempts indicates weak upward momentum, and the price is likely looking for a stronger bottom to launch from.
4. 📉 Short-term downward trend:
The overall trend is leaning towards temporary decline due to the price's inability to hold above 118,000.
The next closest support level is 115,000 – 113,000.
5. 💥 Potential bullish reversal:
If a Double Bottom pattern forms in the range of 115k–113k, we may witness a strong rebound targeting 120,000 initially.
---
🎯 Suggested entry points:
✅ Partial buy entry at: 115,500 – 116,200 USDT
🎯 First target: 118,800 USDT
🎯 Second target: 120,500 USDT
🛑 Stop loss: 112,800 USDT
🔁 The trade can be reinforced if the price holds above 118,800 with strong volume.
---
📌 Summary:
> Bitcoin is currently in a consolidation zone after a sharp decline. A break of 118,800 with volume will be a strong buy signal. Meanwhile, a break of 113,000 will lead to a new wave of decline.
---
📢 Will you seize the opportunity? Share your predictions in the comments!