🧠 Key Characteristics of a Double Top Pattern
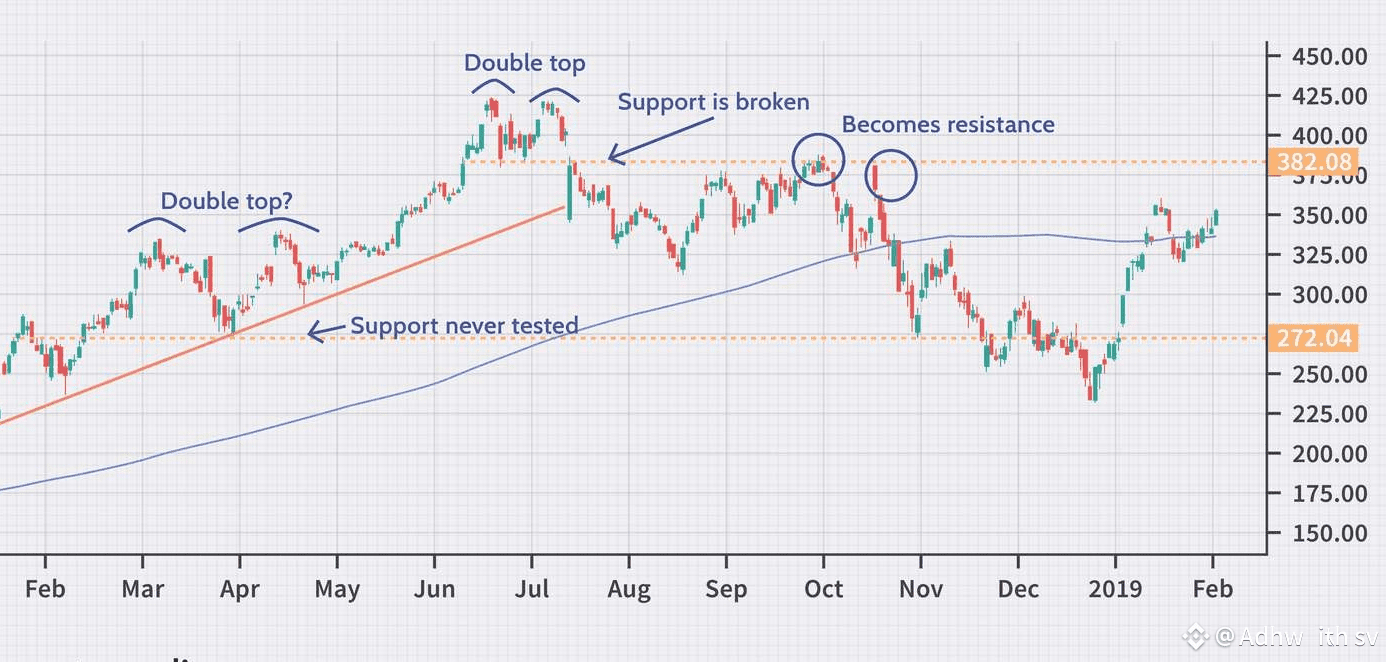
Two Peaks (Tops):
Prices rise to a resistance level (Top 1), then fall.
Prices rise again to the same or similar level (Top 2), and fall again.
The two peaks should be roughly equal in height and separated by a moderate pullback.
Neckline:
The support level between the two tops.
Usually formed by the lowest point between the two peaks.
Breakdown Confirmation:
The pattern is confirmed when the price breaks below the neckline with increased volume.
📉Structure
Top 1 Top 2
∧ ∧
/ \ / \
/ \ / \
/ \_____/ \___
Neckline
📎 Notes
Volume often decreases during the rise to the second top and increases during the neckline breakdown.
Works better on higher timeframes.
Can be invalidated if price breaks above the second point.
🔍 Real-World Example (Amazon, Sept–Oct 2018)
Peaks: Two tops formed near $2,050, with a pullback in between.
Neckline: Located around $1,880.
Breakout: Once the price dropped below $1,880, the pattern was confirmed.
Result: Amazon fell nearly 31% from that point.
⏱️ Pattern Timeline & Considerations
Can form over weeks to months—longer timeframes tend to be more reliable
Don’t forget to watch volume: it usually dips on the second peak, then spikes on the neckline break
🧭 Tips & Pitfalls
False Breakouts: The price may dip below the neckline briefly then rebound – using volume, and sometimes waiting for retest, helps filter these
Rising on retest: Some traders wait for price to bounce up to the neckline after the break, then resume downtrend—offering another potential entry point
✅ Summary
A Double Top is a powerful reversal pattern:
Two similar highs = possible exhaustion of uptrend.
Neckline break confirms bearish shift.
Defines clear entry, stop, and profit target.

