The 15-minute $BONK
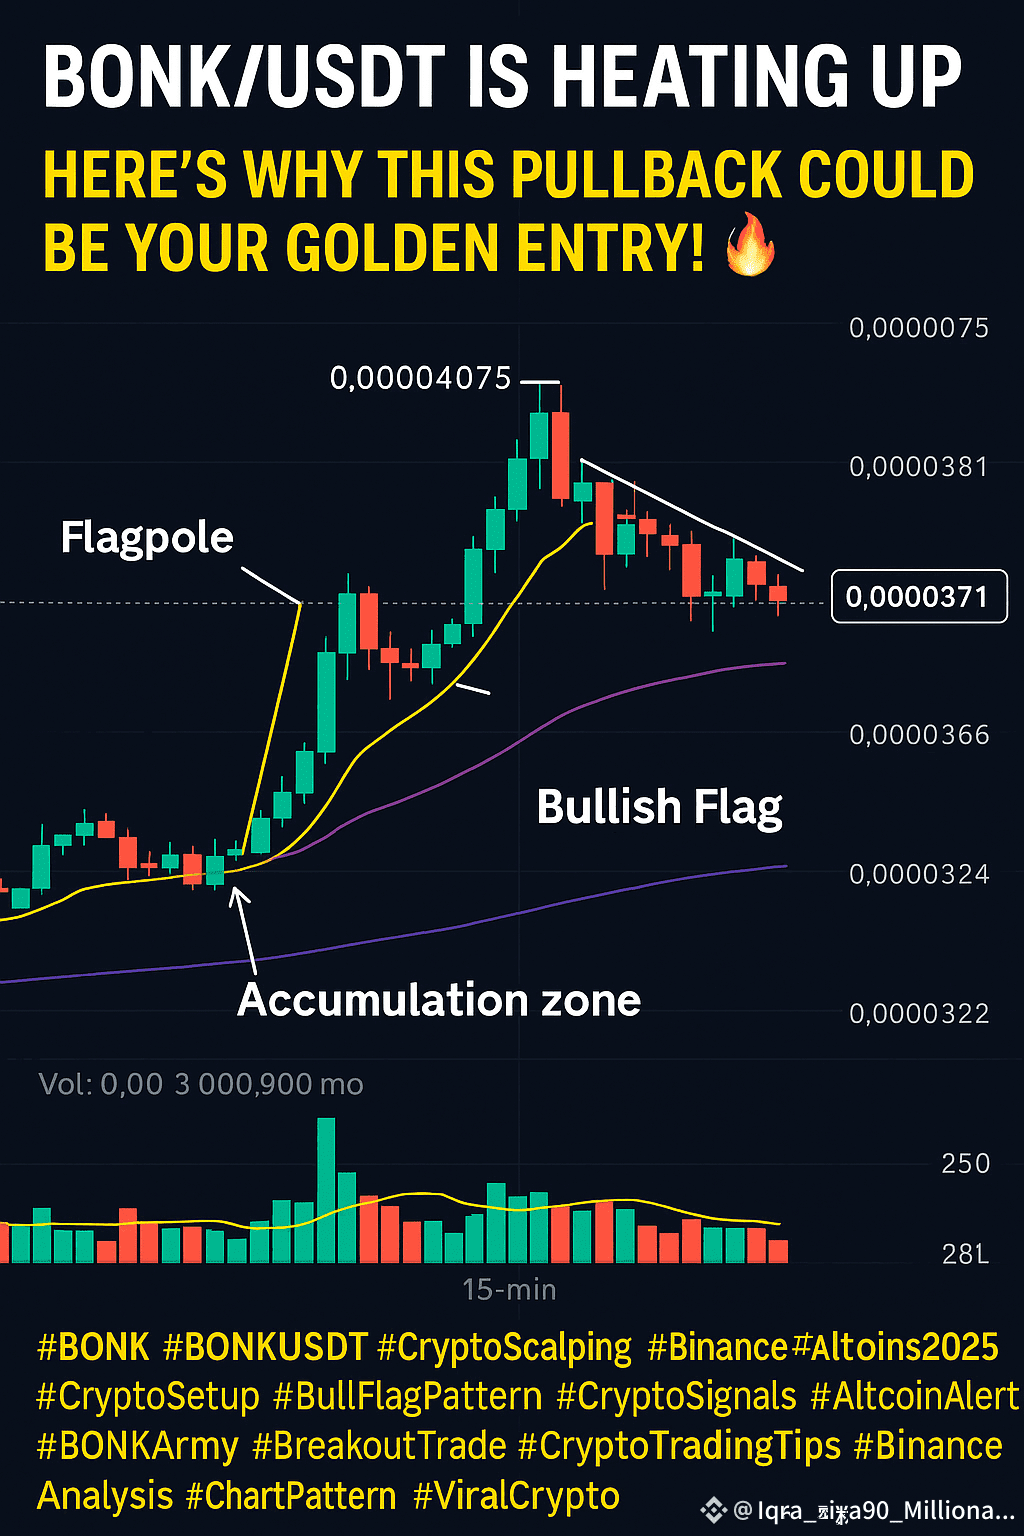
BONK/USDT chart just revealed a classic bullish scenario that scalpers and smart traders love to ride. After a parabolic rise from the $0.00003224 zone, BONK rocketed to $0.00004075, before entering a healthy, controlled pullback.
But this isn’t just a dip — this is the setup before the sprint.
📉 The Pattern You Can’t Ignore
What we’re witnessing is a textbook Bullish Flag Formation:
A strong impulsive move up (flagpole)
Followed by sideways-to-downward movement (flag), consolidating above support
Volume is decreasing — a classic sign of a potential breakout build-up!
This pullback is currently testing the MA(25) and hovering above the MA(99) — two critical levels often used by institutional scalpers to gauge momentum.
🧠 What the Smart Money Is Watching:
If $BONK holds above 0.00003665, expect a bounce back toward 0.00003891, followed by a retest of the 0.00004075 high
A breakout above that high, with volume, could ignite a new rally to uncharted zones
This is the type of setup where retail panic meets whale accumulation — and those who recognize the signs early, win big.
✅ Scalping Plan (Not Financial Advice):
Entry Zone: 0.0000365 – 0.0000372
Target 1: 0.0000389
Target 2: 0.0000407+
SL: 0.0000358 (tight and clean)