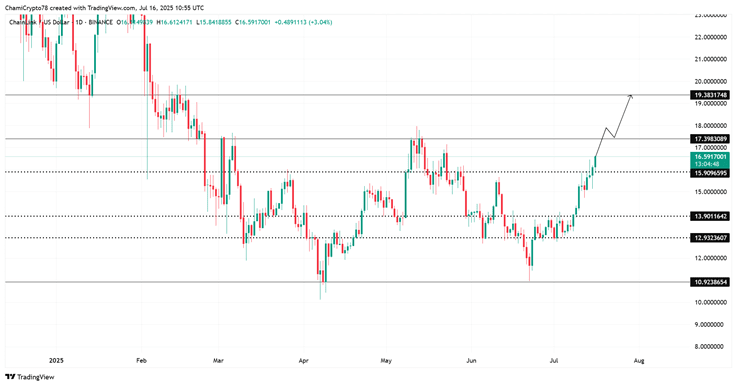
Chainlink (LINK) is expanding its bullish trend, forming a clear bullish structure as it approaches the critical resistance level at $17.39. After reclaiming the mid-range at $15.9, LINK has consistently created higher lows and highs, indicating steady buying pressure from the bulls.
At the time of writing, LINK is trading at $16.66, approaching the price range that previously halted prior rallies.
Although the price has previously tested this resistance area, it has not been able to break through. So, will this retest lead to a breakout or another correction?
Will sustained spot demand push LINK past the 'wall' of resistance?
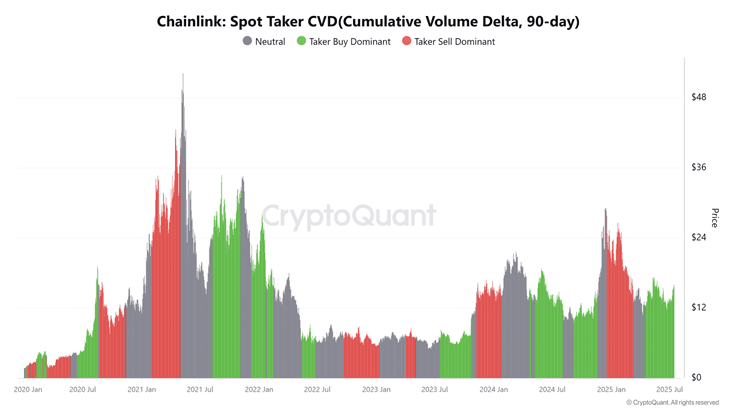
The Taker Buy Volume Dominance index continues to lean towards the bulls, as reflected in the positive Spot Taker CVD over the 90-day timeframe.
This indicates that active buyers continue to dominate over sellers in LINK's spot market — a trend that often supports prolonged price increases.
However, this indicator alone is not enough to ensure a breakout. If trading activity on exchanges does not increase significantly, the upward momentum may falter.
Nevertheless, the dominance of active buyers still reflects strong demand supporting LINK's recovery.
Is the LINK market too hot?
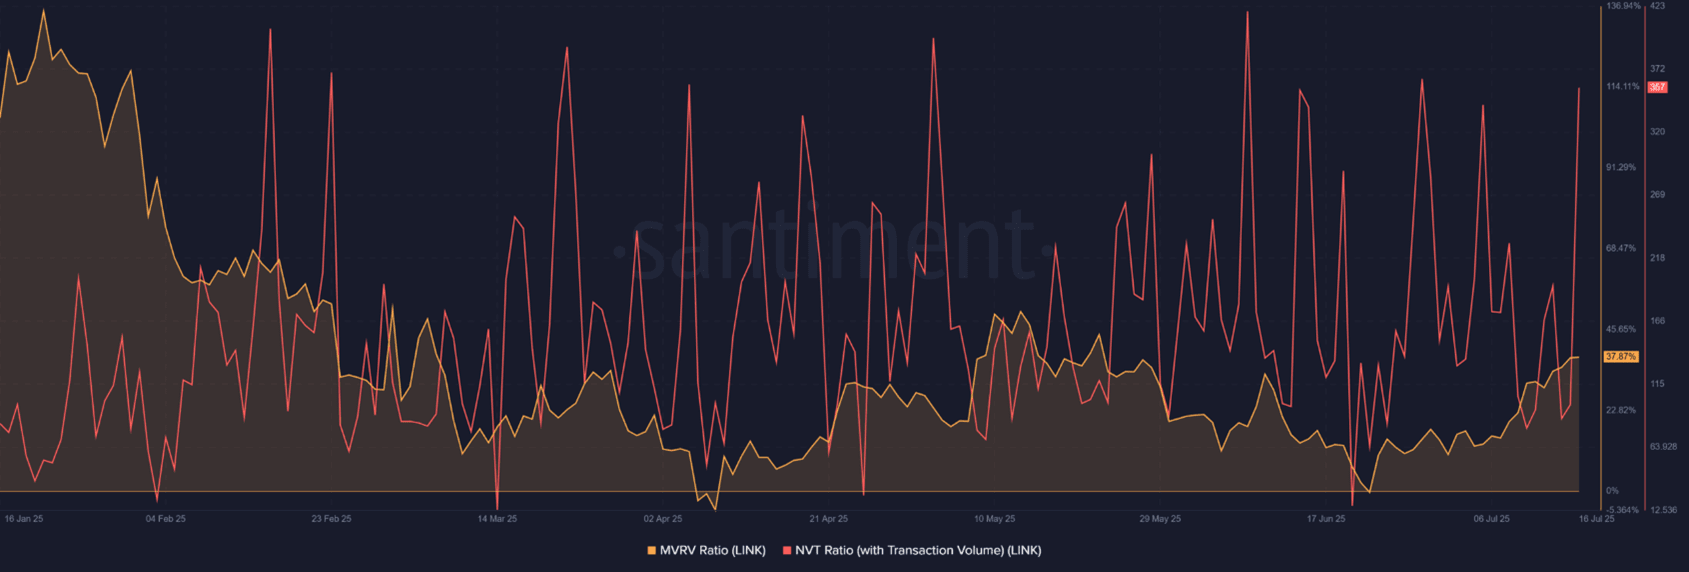
The MVRV ratio has risen to 37.87% at the time of writing, meaning a majority of holders are in profit. Historically, such high levels often lead to local tops due to increased profit-taking sentiment.
Additionally, the NVT ratio continues to show spikes, which often indicates an imbalance between price and actual network activity.
Although rising prices may reflect optimism, a sharp rise in NVT signals that prices are far exceeding the actual on-chain utility.
Therefore, although market sentiment remains skewed towards a bullish trend, LINK may be entering a speculative zone where traders should closely monitor the risk of reversal.
What does the reversal in the funding rate say about market sentiment?
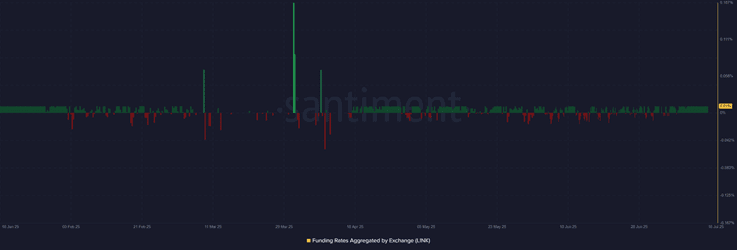
After several weeks in negative territory, the funding rate has turned positive at the time of writing, indicating an increasing preference for Long positions on the derivatives platform.
A positive funding rate means traders are willing to pay fees to maintain Long positions, reflecting a higher level of trader confidence.
However, this confidence comes with risks — if the price does not continue to rise, Long positions may face liquidation pressure.
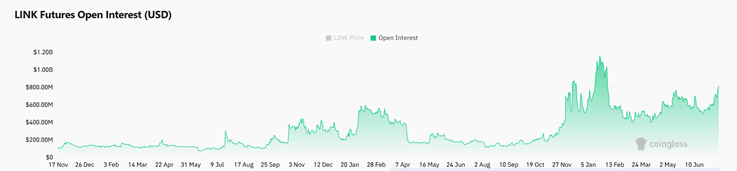
Is the rising OI driving upward momentum or increasing the risk of volatility?
At the time of writing, open interest (OI) has increased by 8.47% in the past 24 hours, reaching $843.05 million, indicating strong participation from derivatives traders. This upward trend indicates a more vibrant speculative sentiment that aligns with the ongoing price increase.
However, high OI may also signal the risk of significant volatility, especially as highly leveraged positions could be liquidated.
Binance's heatmap shows liquidation positions concentrated just below the $17 mark, suggesting that a breakout or rejection here could trigger swift price movements.
Therefore, although the upward momentum is maintained, investors should exercise caution near the resistance zone.
Will LINK break out or remain stuck in the range?
Chainlink is showing strength again as the bulls push the price close to the important resistance around $17.5. Spot demand, funding rate, and OI all support a bullish outlook.
However, on-chain metrics and liquidation events suggest that the possibility of price rejection still exists. Whether LINK can turn this price range into support or face another rejection will determine its short-term trend.