You will never earn money beyond your understanding. If you earn money through luck or solely by others' advice, you will eventually lose it back to the market. This sounds harsh but is very true. As the saying goes, 'Sharpening the axe does not delay the work of cutting wood.' Before becoming an investor, enhancing your understanding is a necessary path. Reading and mastering decades of experience from predecessors is undoubtedly an efficient method.
I have been struggling in the secondary market for ten years, and I have encountered over 10,000 investors, but fewer than 10 have truly achieved financial freedom, resulting in a success rate of less than 1%.
Previously, I also played in the stock market for a few years and gained some insights. Later, I entered the cryptocurrency space and became a small retail investor. Initially, I also experienced despair, and it was this process of despair that made me more determined to persist. In failure, I understood one principle: you must find the reasons for your failures and diligently learn. Learning is the best way to get through bear markets and low points.
Before discussing technology, I strictly follow the survival laws of the cryptocurrency circle: 15 iron rules for navigating volatility.
In the unpredictable cryptocurrency space, survival is the ultimate victory. There are no celebrations for the lucky; only long-lasting wins for those who strictly adhere to the rules. The following 15 survival rules are key guides for navigating market cycles.
1. Capital first: Prioritize safety, better to miss than to rush in. Ignoring the risks will ultimately backfire on all profits.
2. Avoid greed and seek stability: Give up the fantasy of getting rich quickly; accumulating small profits is better than gambling. Restrain desires to seize real opportunities.
3. Diversify to mitigate risks: use asset allocation to spread risks, keeping over 20% in cash. Liquidity is a lifesaver when the market reverses.
4. Strictly adhere to discipline: Stay away from down-trending coins and refuse to chase highs and sell lows. Impulsive trading will only cost you 'tuition fees' in the market.
5. Know when to enter and exit: Accumulate positions gradually during sideways markets, and decisively take profits upon reaching targets. Avoid greed and attachment to battles; only then can the true essence be seen.
6. Respect risks: There is no end to the money that can be made in the market, but the balance may go to zero. Knowing when to take profits is key to lasting success.
7. Decisive stop-loss: Cut losses promptly when fundamentals worsen. Hesitation can turn small losses into deep abysses; preserving capital is essential for the future.
8. Go with the trend: Look at weekly lines for long-term, monthly lines for ultra-long-term. When trends reverse, take profits promptly and do not resist forcefully.
9. Beware of extremes: Reversals often occur after sharp rises and falls. Always remain clear-headed about 'irrational exuberance'.
10. Better to have less than more: 90% of the market is noise. Learn to wait with cash on hand; missing out is not regrettable, but making a mistake is fatal.
11. Patience wins: Instead of blindly looking for opportunities, wait for the trend to clarify. Top trading wins by waiting.
12. Know when to stop: Set profit targets and rest promptly upon reaching them. Maintaining rationality is more important than pursuing the extreme.
13. Stop-loss is a responsibility: Stop-loss is the bottom line, while profits depend on the market. Don’t mistake luck for ability; taking chances can ruin plans.
14. Time compounding: Frequent trading depletes capital. Stick to the trend and endure loneliness to preserve wealth.
15. Unity of knowledge and action: No matter how perfect the strategy, without execution, it's all talk. Use discipline to combat emotional demons and let reason lead trading.
These rules condense countless lessons learned through blood and tears. Only by ingraining these rules into your very being can you truly become a survivor and victor in the turbulent cryptocurrency space.
This article shares the application of candlestick moving averages. We all know the importance of candlesticks in the stock market, but in the cryptocurrency space, these candlestick theories only apply to some. Not all indicator analyses are useful in the cryptocurrency space. Although the accuracy of candlestick technology is not 100%, many candlestick concepts, once learned, seem not very useful. In fact, according to the experience of many experts, candlestick technology plays a crucial role in long-term analysis of cryptocurrency prices. Regardless of the direction the price is heading, it will manifest in trading. We can use these techniques to understand the direction of prices. Candlesticks speak of probabilities and guide you towards a bright path when you are confused.
Without further ado, let's get to the point. Today we mainly need foundational indicator strategies: 1. Usage and settings of moving averages 2. RSI indicator usage 3. Value investing.
1. How to use moving averages to judge trends.
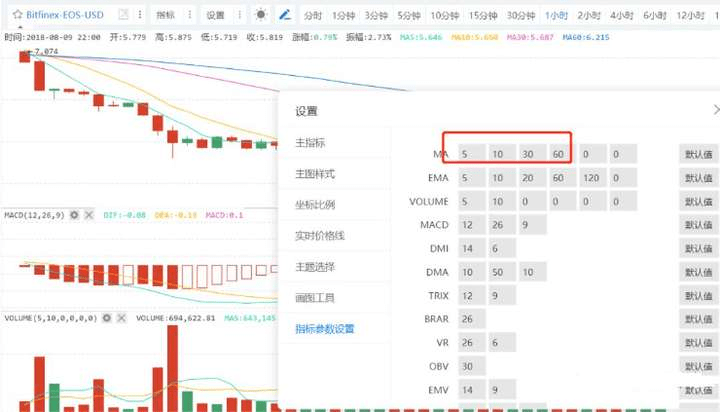
1. First, let's learn how to set indicators.
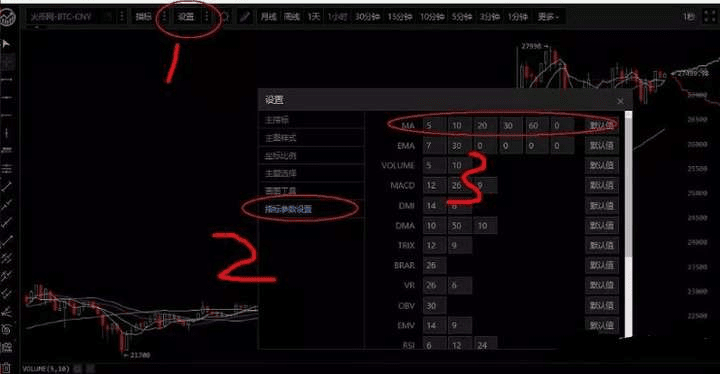
Due to some updates in the settings of Huobi, if you can't find something, you can directly click the lines with your mouse.
You can see these few lines; click directly on the line to change it.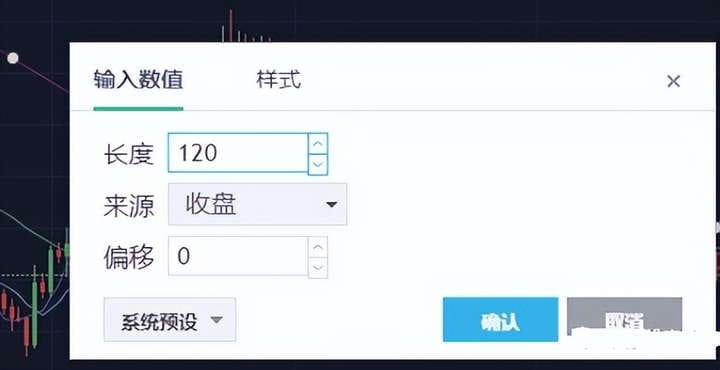

After clicking, you can change it directly here. First, the moving averages we need are: 5-day line, 30-day line, 60-day line, 120-day line. If you find it hard to use, you can even change the 5-day line to a 4-day line for more agile market response.
2. Short-term moving average indicators: 5-day line strategy.
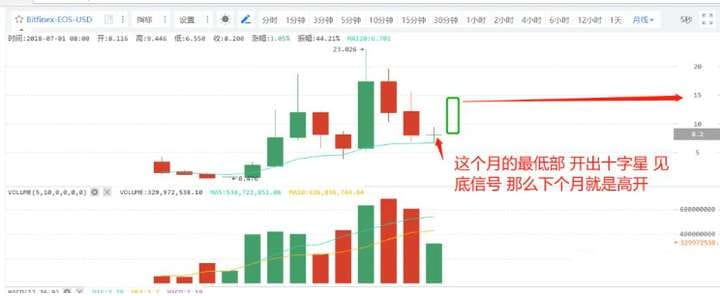
The 5-day line is commonly used for short-term analysis. What is the 5-day line? The 5-day line is the sum of the closing prices over five days divided by five. Generally, the system is set up for weekly lines, which is essentially the average price over a week. However, a week is too long and reflects changes relatively slowly. There are also experts who use the 4-day line, among others, which can be intuitively displayed through settings.
The 5-day line is the most practical for short-term judgment. The 5-day line represents the holding price range for everyone over the past five days, indicating the buying and selling signals within that timeframe and the average holding cost. The same applies when the moving average changes.
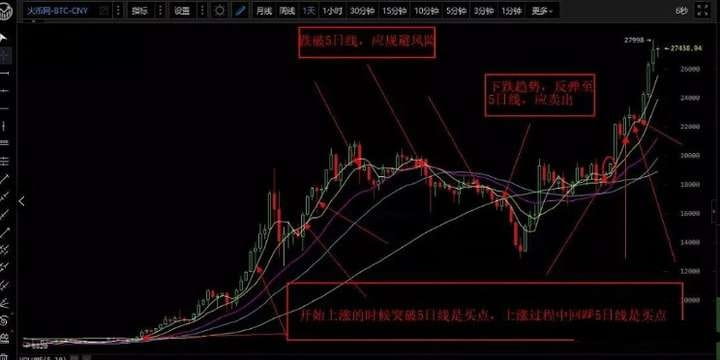
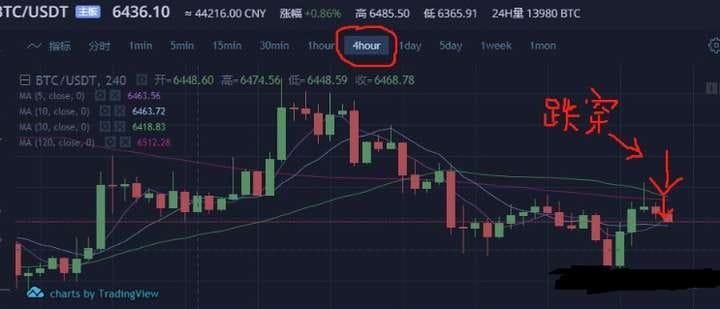
Usage: In a bull market, when the price retraces to the 5-day line, it's time to increase positions (if it rapidly breaks through, one should observe); in a bear market, when the price falls below the 5-day line, you must sell quickly. As long as it doesn't break below the 5-day line, there shouldn't be major issues. During a consolidation period, you can refer to the 1-hour and 4-hour lines, which is the short-term usage.
This theory requires exploration by everyone because very few people will tell you that when you encounter many issues in practice, you need to validate them more. Undoubtedly, the 5-day line strategy is very useful in practice, and it is one of the indicators that short-term experts must rely on.
Why use the 5-day line? There’s a saying that in the cryptocurrency world, one day equals one year in the real world; the market reacts particularly quickly. Using a conventional 7-day line would be relatively slow and unable to keep up with market changes. We all know that the price fluctuations in cryptocurrencies are unlimited, and trading occurs 24 hours a day.
If the 5-day line is used as a judgment standard, then when the price reaches the 5-day line, it will form a support level. If sold, it will break below the 5-day line, and if you want to wait until it returns to the cost price, you can only wait, and this point will also form a support level.
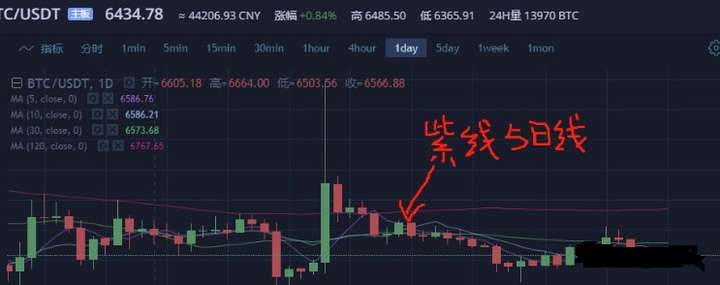
It shows that the current price still hasn't stabilized above the 5-day line, and there are still many uncertainties. At this time, we should use the 1-hour and 4-hour lines.
Practical summary: This strategy mainly focuses on short-term indicators. When approaching the moving average, which is essentially the average cost price for everyone, selling pressure will decrease, and thus the price will tend to rise again. If it deviates too far from the moving average, the probability of adjustment will increase. This is primarily because investors will choose to take profits, leading to a price drop.
3. 30-day line and 10-day line combined with short-term strategies:
The 30-day line is also a short- to medium-term strategy. If you are not so fond of trading, we recommend this set of strategies to you.
The old rule still applies, if previously set according to my settings: 5-day line, 30-day line, 60-day line, 120-day line, then change the 60-day line to a 10-day line. Because this set of indicators only requires the use of the 10-day line and the 30-day line.
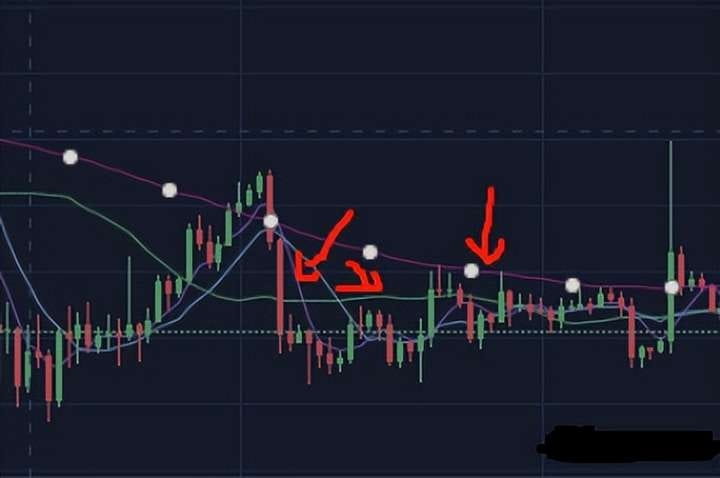
This set of indicators is relatively simple: sell when it breaks below the 10-day line, buy when it breaks above the 30-day line. The time frame is changed to one hour, as detailed in the chart.
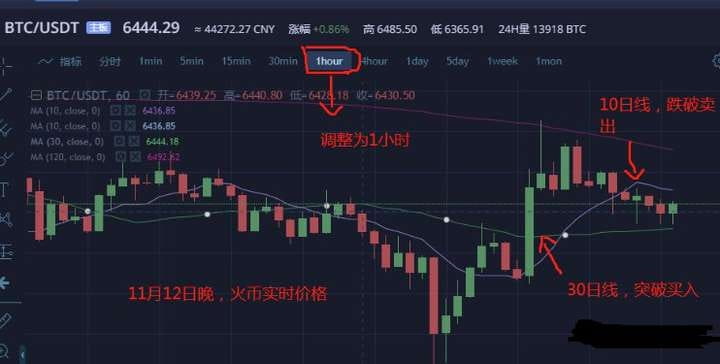
This theory is similar to the 5-day line; the 30-day line represents short- to medium-term trends. When set to one hour, it becomes a short-term buying point. If it drops below the 10-day line, a short-term downtrend opens up. This combination and application in real practice is very effective.
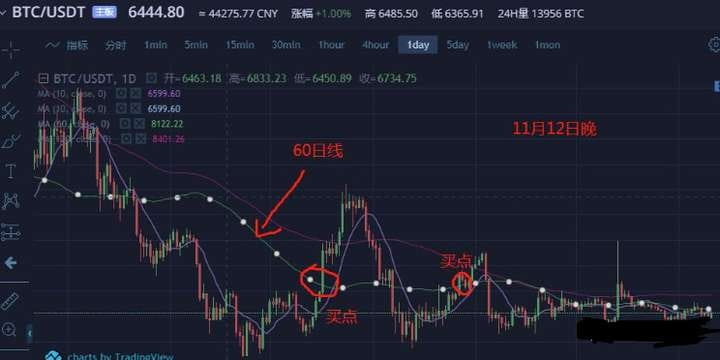
4. Medium- and long-term strategy: 60-day line and 120-day line.
Speaking of the 120-day line, it is the dividing line between bull and bear markets.
Speaking of the 120-day line, it is the dividing line between bull and bear markets.
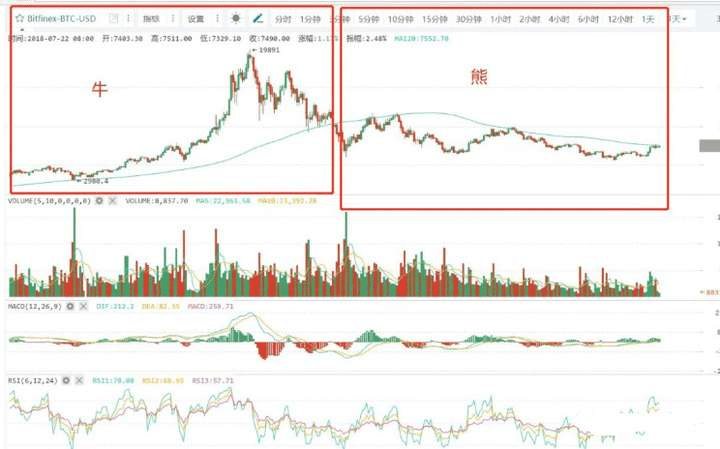
So how to use the 120-day line for investment?
This is the previous technical chart, and according to the current market, it has not broken through the 120-day line. The usage of the 120-day line is actually a technical indicator for judging long-term trends. In daily trading, it is also a reference. This bear market has not yet ended, and once it breaks through the 120-day line, it serves as an indicator that a bull market is coming.
We often see various experts discussing support and resistance levels, which actually refer to moving averages. When analyzing major trends, those doing long-term investments should not rely solely on the 5-day line strategy; the primary reference moving average for bull-bear transitions is the 120-day moving average.
5. Box waves observe pressure and support.
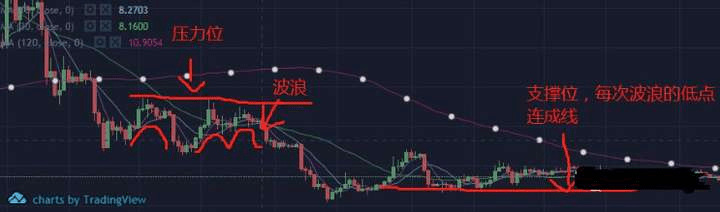
This comes from Elliott Wave Theory, which provides a good explanation of wave strategies. Many novices in the stock market have profited using this theory for years. Of course, its practicality is uncertain; seeing is believing. Here we will briefly introduce box wave support and resistance levels.
When a cryptocurrency price runs within a certain box, the highest point of each wave forms a line, which is the resistance level. The bottom of the waves connected forms a line, which is the support level.
A general judgment is that a breakout may usher in a higher advance. In such cases, how should one choose? The main point comes from fundamentals, such as the release of positive news or significant capital entering the market, which can lead to a wave of momentum. Another scenario is post-breakout consolidation, which is also quite common, indicating that funds are lacking the strength to push higher or that selling pressure is too great. At this time, one must be cautious. Of course, such spans can be quite large and can only serve as a reference.
Using box waves to observe each low and high point helps judge support and resistance, which is also a common analysis method. It’s brainlessly simple, but not that accurate. You can explore this in daily practice or refer to wave theory technical books. To be honest, I have read several good wave books, but their practical effect in real trading is not that great. However, this does not mean that everyone will not see results after reading; everything still relies on practical exploration. I prefer practical techniques rather than conceptual things. What do you think?
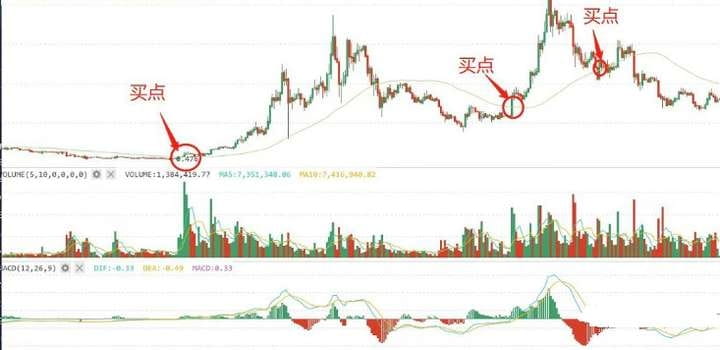
6. RSI bottom-fishing and top-exiting rules.
RSI is also an old technical indicator in the stock market and works particularly well as a reference in the cryptocurrency space.
The RSI indicator represents a measure of strength, calculated based on the rise and fall of cryptocurrency prices.
The principle of the RSI indicator is simply to calculate the power comparison between buyers and sellers using numbers. For example, if 100 people buy a cryptocurrency, 60 buy and 40 sell, the price will rise.
So how is it used? 80-100 is a very strong sell; 20-50 is a very strong buy; weak observation 0-20 is very weak buy. Once it reaches a golden cross, it becomes a buying and selling point.
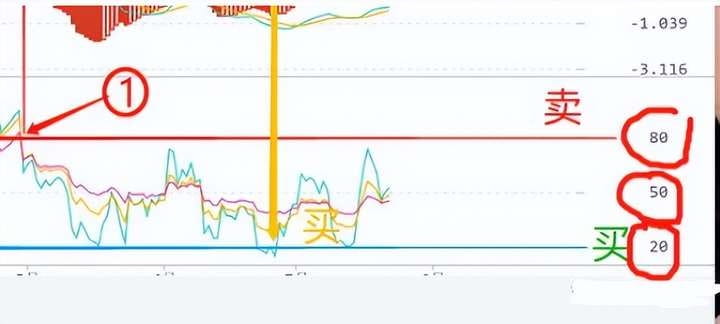
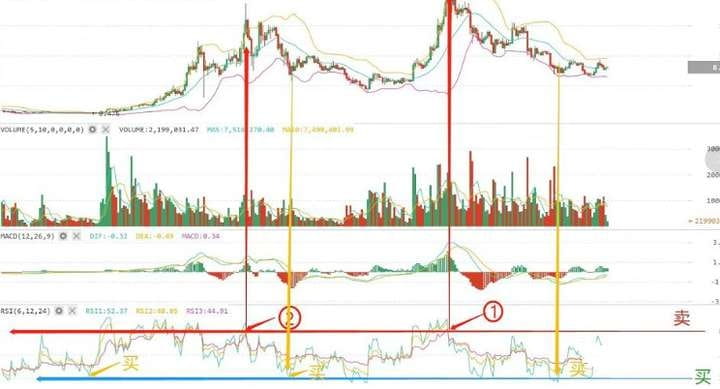
Note that if it reaches 80, there is a significant risk of a retracement. So when should you sell? Sell at the moment it drops below 80. The RSI technology has been validated by the market; it has been in use since 1978, showcasing its reference value. In the emerging cryptocurrency space, this set of indicators can also effectively lead you to victory.
Short-term fluctuations can be operated using the 1-hour line to achieve peak exits.
Summary: Let's review the five technical indicators we discussed today: the 5-day line strategy, the combination of the 10-day line and the 30-day line, the roles of the medium- to long-term strategies of the 60-day line and the 120-day line, box wave support and resistance levels, and the RSI bottom-fishing and top-exiting rules. The above reference indicators, while many are quite simple, often the simplest reference indicators are actually the most useful. In practical trading, I believe that one of these methods will bring you a different investment experience and become a powerful tool on your investment journey.
Even the most diligent fisherman wouldn't go out to sea during a storm; instead, they would carefully safeguard their boat. This season will pass, and a sunny day will eventually come! Follow Yan An for guidance in both catching fish and fishing techniques; the doors of the cryptocurrency space are always open. Acting in accordance with the trend is the only way to lead a successful life; remember this and keep it in mind!
