I have transformed from a newcomer in the cryptocurrency space to a person who makes a living from trading cryptocurrencies, having seen too many people of all kinds. Many have traded for years and are still seeking the path to become winners or super winners. However, as a trader, have you ever done a deep analysis to understand where you lost, and what were the reasons for winning?
The reason I can now support my family by trading cryptocurrencies is that I truly love the crypto space and have spent a lot of time learning. I would like to share my trading insights with everyone. If you want to change your current situation, please read to the end. The words are short, but each is worth its weight in gold. If you find it useless after reading, feel free to say what you like! I will also talk about how to make money in trading later. [This article is full of practical knowledge.]
There are many factors that lead to losses in cryptocurrency trading. In summary, they can be categorized into the following six points. As long as you contradict these six points, you can become an exceptional individual.
1. Severe short-term thinking.
Simply put, we should focus our sights further ahead; what everyone discusses and sees is how much it has risen today, how much it has fallen tomorrow, rather than how this coin will perform in half a year or a year. You can see that those who have achieved financial freedom in the cryptocurrency space are not people who made money in just three to five days; they all rely on time to endure.
Reasonably allocate positions, primarily focusing on long-term, with medium- and short-term strategies as supplements; if you can accurately observe short-term trend changes, you should follow them.
2. Chase high and sell low.
Chasing high and selling low is a mistake that almost every cryptocurrency investor makes. They see a coin skyrocketing, and everyone in the world is discussing it, so they buy in. After buying, when they end up stuck and lose 10% or 20%, they hesitate to cut losses, waiting for the day they can break even. When the price continues to drop, losing 50%, even 60% or 70%, they then believe the coin is not good and panic sell it to the floor.
Then repeat this step again and again, and there really isn't a good solution to the problem of chasing highs and selling lows; it’s a psychological issue.
3. Insufficient understanding.
Many people do not think before investing; they just follow what others say. When a certain influencer says this coin is good, they buy it immediately! When tomorrow some rumor says that coin will rise, they follow and buy... As for why this coin is good or why that coin will rise, they have no idea.
This kind of thoughtless investment method is not losing money; it’s against reason. When investing, we can use others' insights as references, but before that, we must establish our own understanding. Even if an influencer is great, they first established their position before advising you, and they will alert you only after they have sold; you are merely their passenger.
4. An overly restless mind.
Restlessness seems to have become the norm in the cryptocurrency market. Many people enter this market with the mindset of getting rich overnight, but they are not prepared for the possibility of losing everything the next day, nor do they have the ability to get rich overnight! After buying a coin, they hope it will rise immediately, double in three days, and increase tenfold in half a month... If the coin does not rise for half a month or even incurs losses, they start making excuses for themselves and vent their frustrations, blaming the projects for not managing market capitalization, cursing the manipulators, and accusing influencers of inaccurate predictions.
Having seen too many stories of overnight wealth in the cryptocurrency market, and almost every time period around me sees the birth of tenfold and hundredfold coins, subconsciously treating the cryptocurrency space as a 100% winning casino, believing that as long as I buy coins, I can make money, without viewing it as a real financial market; bloodthirstiness is the essence of the financial market.
5. Not studying.
Previously, a media outlet conducted a survey on investors' understanding of digital currencies. Among 778 randomly selected digital asset investors, less than 10% could quickly and accurately describe 'what Bitcoin is?' Only 17 people could accurately explain 'what blockchain technology is?'
Although the sample size of this data is very small, it is enough to illustrate the current overall situation of cryptocurrency investors. If you can't even figure out what you are investing in, how can you have faith? Without faith, how can you hold onto chips that are at a low price or good coins?
Learning is an eternal wealth; only continuous learning can prevent being harvested.
6. Lacking sound investment concepts.
Most people do not have a complete investment plan before investing, completely following their feelings. This kind of intuitive investment method is highly likely to result in losses when unexpected situations arise. Only by summarizing a set of investment strategies suitable for oneself can we cope with various situations, whether the market rises or falls, allowing us to maintain a calm mindset, which can help avoid making wrong choices due to emotional influences.
As a newcomer to the cryptocurrency space, understanding candlesticks is essential knowledge; it is the foundation of all technical analysis. Learning to interpret candlestick charts is crucial for capturing cryptocurrency trends.
The most fundamental indicators in the cryptocurrency market: candlesticks, trading volume.
What is a candlestick chart? A candlestick chart, also known as a candle chart, is one of the most commonly used tools in cryptocurrency analysis. It visually displays price changes in the cryptocurrency market through 'candles,' allowing you to see the rise and fall of cryptocurrency at a glance.
The basic structure of candlesticks: Each candlestick represents the price changes over a certain period, with common time units including 1 minute, 5 minutes, daily, etc. Highest point: the upper shadow of the candlestick. Lowest point: the lower shadow of the candlestick.
Common candlestick patterns: Naked bullish and bearish lines (large bullish candles/large bearish candles): Indicate a large fluctuation in the cryptocurrency market for that day. Doji: Indicates market uncertainty; reversal may occur at this point. Hammer candlestick: Indicates a potential bottom reversal and may serve as a buy signal.
How to use candlestick charts for cryptocurrency analysis? Look at trends: By analyzing the arrangement of candlesticks, determine whether the cryptocurrency market is in an uptrend, downtrend, or consolidation. Combine with other indicators: such as moving averages, MACD, etc., to enhance judgment accuracy.
Set buy and sell points: When a reversal pattern appears on the candlestick chart, consider entering or exiting the market.
Below, I will introduce some candlestick patterns commonly encountered in the cryptocurrency market.
1. Doji candlestick.
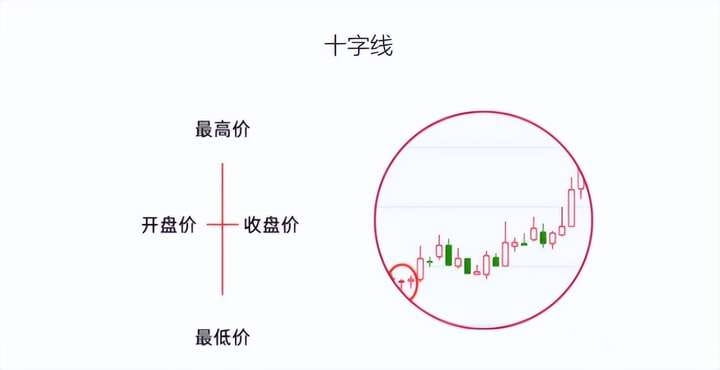
A doji indicates the fact that the forces of bulls and bears are balanced. Generally speaking, a reversal is likely to occur after a doji, changing the previous trend direction. If a doji appears during an upward movement, it indicates that the upward momentum is weakening; if it appears during a downward movement, it indicates that the downward momentum is weakening; if it appears in a sideways trend or multiple dojis appear at the same price level, then the doji does not provide a signal for trend change.
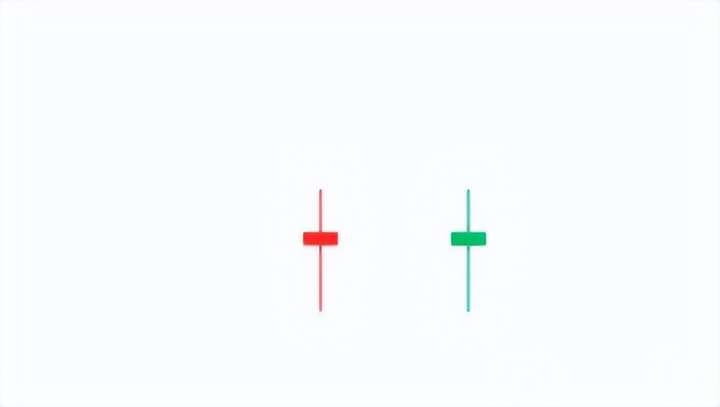
2. T sub-candle.
T-shaped candlestick.
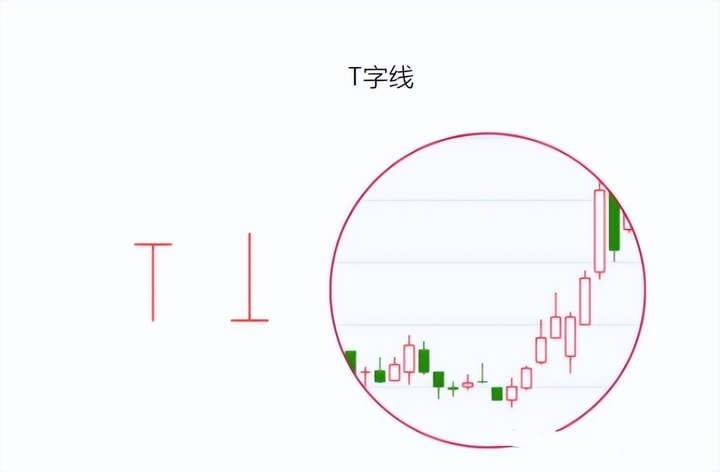
A T-shaped candlestick appearing at a low level indicates strong buying support, and there is a possibility of a rebound.
A T-shaped candlestick appearing at a high level indicates severe selling pressure and may signal a potential reversal downward.
If the T-shaped candlestick appears in the middle of an upward trend, it indicates that there is still upward space for future movements.
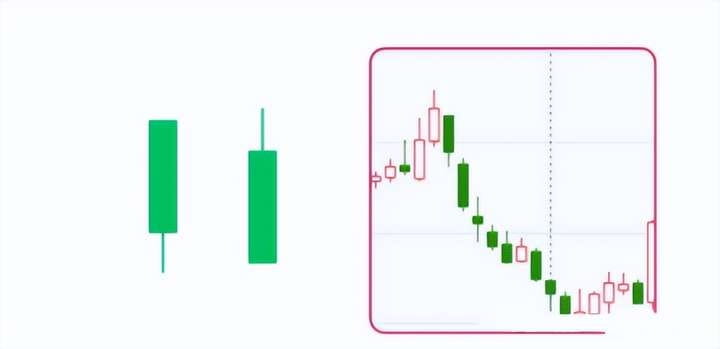
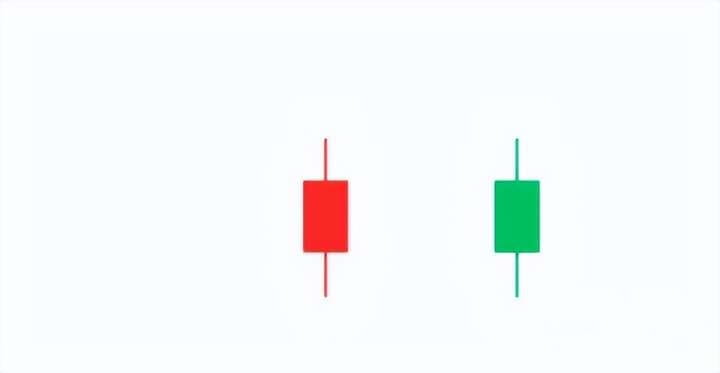
3. Naked bullish and bearish candles.
A naked bullish candle has a body and a lower shadow, with no upper shadow. If a naked bullish candle appears at a low level, it may indicate the beginning of a new upward trend after testing the bottom. If it appears during an upward trend, it suggests that the market outlook remains positive.
Naked bullish candles, which have a body and are hollow, have upper shadows and no lower shadows, indicate a strong upward momentum.
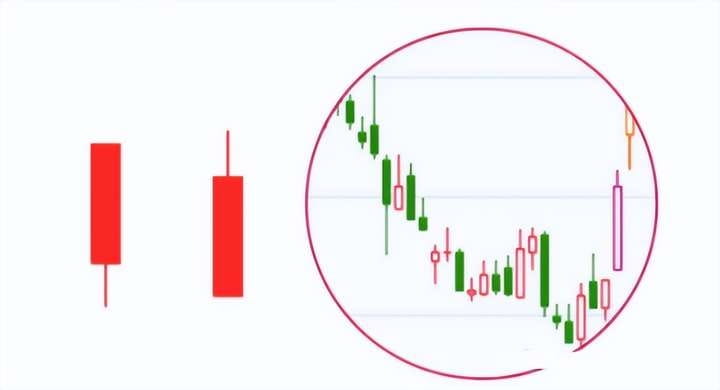
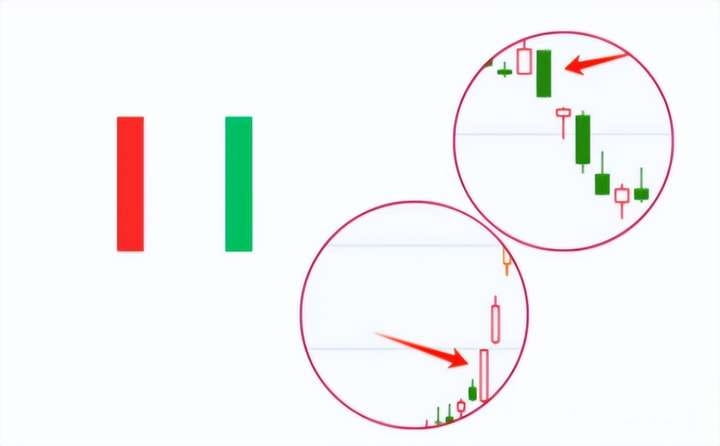
4. Naked bearish candles and naked bullish candles.
A naked bearish candle refers to a bearish candle with a lower shadow, where the opening price is the highest price of the day. Once the market opens, the selling pressure is particularly strong, and the price continues to decline. However, when it drops to a low point, it is supported by buying pressure, potentially leading to a rebound.
A naked bearish candle has a bearish body, an upper shadow, and no lower shadow. If a naked bearish candle appears at a low level, it suggests that there may be signs of a rebound, but the strength of the rebound may not be significant.
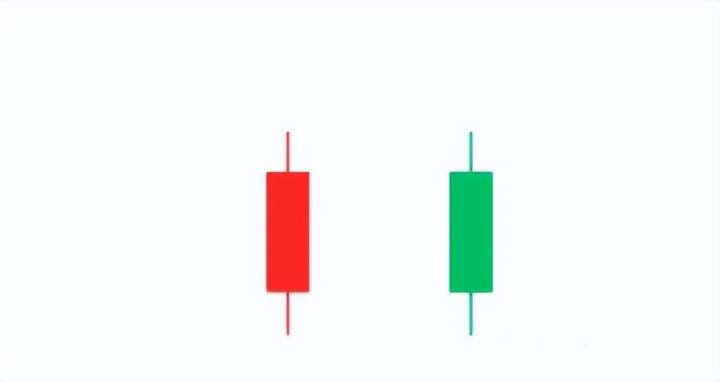
5. Naked bullish and bearish candles.
Naked bullish candles, which have a body and no upper or lower shadows, indicate an upward trend. Naked bullish candles suggest that subsequent movements are likely to have strong upward momentum.
A naked bullish and bearish candle refers to a candle with a body and no upper or lower shadows. A naked bullish and bearish candle indicates a downward trend, and subsequent movements are likely to be strong declines, with a high chance of a gap down the next day.
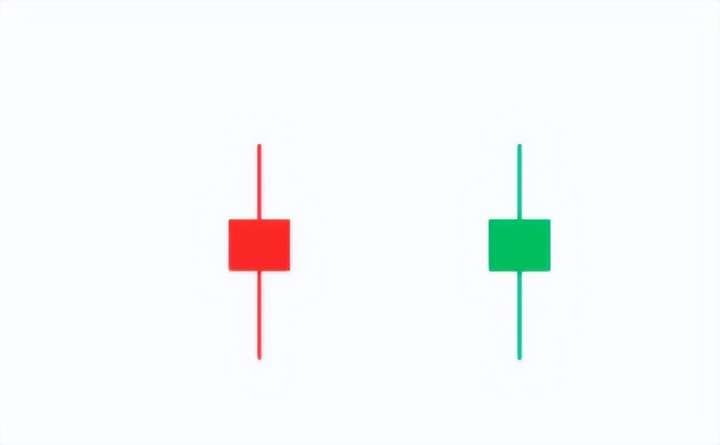
6. Small bullish stars and small bearish stars.
The body parts of small bullish stars and small bearish stars are very short.
A small bullish star represents very small price fluctuations, with the opening price and closing price being extremely close, and the closing price slightly higher than the opening price. The appearance of a small bullish star indicates that the trend is in a confused and unclear stage, making it difficult to predict subsequent price movements.
Small bearish stars are similar to small bullish stars, but the closing price is slightly lower than the opening price, indicating that the trend is in a state of confusion and uncertainty, making it difficult to predict future price movements.
7. Small bullish and bearish candles.
The body parts of small bullish and bearish candles are slightly longer compared to small bullish stars and small bearish stars.
Small bullish and bearish candles have a fluctuation range of 0.6% to 1.5%. A small bullish candle indicates a lack of momentum in the upward trend, with unclear subsequent movement.
A small bearish candle indicates signs of a downtrend, but the downward strength is not significant, and subsequent movements are not very clear.
8. Medium bullish and bearish candles.
The body parts of medium bullish and bearish candles are slightly longer compared to small bullish and bearish candles.
Unlike small bullish and bearish candles, the market significance of bullish and medium bearish candles is clearer. Medium bullish candles represent a bullish outlook for the market, while medium bearish candles represent a bearish outlook for subsequent movements. Many times, medium bullish and bearish candles become turning points in trends, but they should also be analyzed in conjunction with overall trends.
9. Large bullish and bearish candles.
The fluctuation range of large bullish and bearish candles is over 3.6%. Compared to medium bullish and bearish candles, the market significance of large bullish and bearish candles is clearer.
A large bullish candle indicates that the likelihood of an upward trend dominates, and there's a high possibility of a gap up the next day; a large bearish candle indicates that the likelihood of a downward trend dominates, and there's a high possibility of a gap down the next day.
10. Hammer candlestick / hammer line.
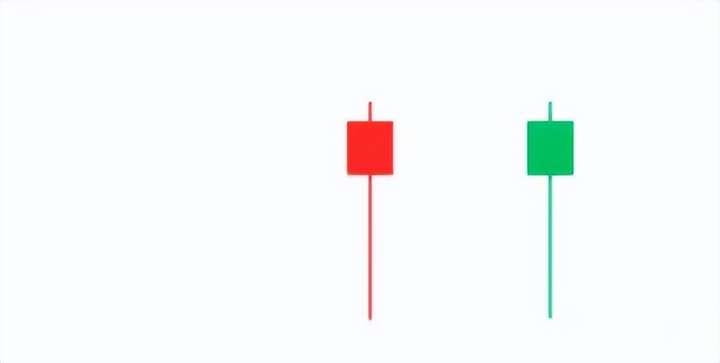
The body is relatively small, with a long lower shadow (2-3 times the body or more), no upper shadow, or only a very short upper shadow. It is referred to as a 'hanging man' at high levels.
(1) If it appears at a high price, it is a signal that the market is peaking; if it appears at a low price, it is a signal that the market is bottoming.
(2), The smaller the body of the hammer candlestick, the longer the lower shadow, the greater the reference value.
(3) After the hammer candlestick appears, if the next candlestick closes as a longer bullish candle with a closing price exceeding the hammer's highest price, the probability of a new upward trend is high.
(4), After the hammer candlestick appears, if the next candlestick is a large bearish candle, the market may maintain a downtrend.
11. Inverted hammer candlestick.
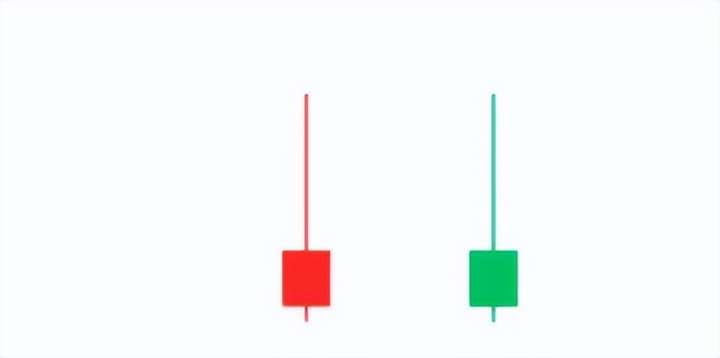
The body is relatively short, with a long upper shadow and no lower shadow or only a very short lower shadow.
(1) If it is at a high price, it is a signal that the market is reaching a peak, and stocks should be sold. If it is at a low price, it is a potential signal that the market is reaching a bottom.
(2) The more disparate the ratio of the body to the upper shadow, the more valuable the signal.
(3) The inverted hammer candlestick is not a strong bullish signal; after it appears, the next candlestick must be awaited for confirmation.
(4) If the next day's opening price of the inverted hammer candlestick gaps up, exceeding the body of the inverted hammer, the larger the gap, the stronger the confirmation signal.
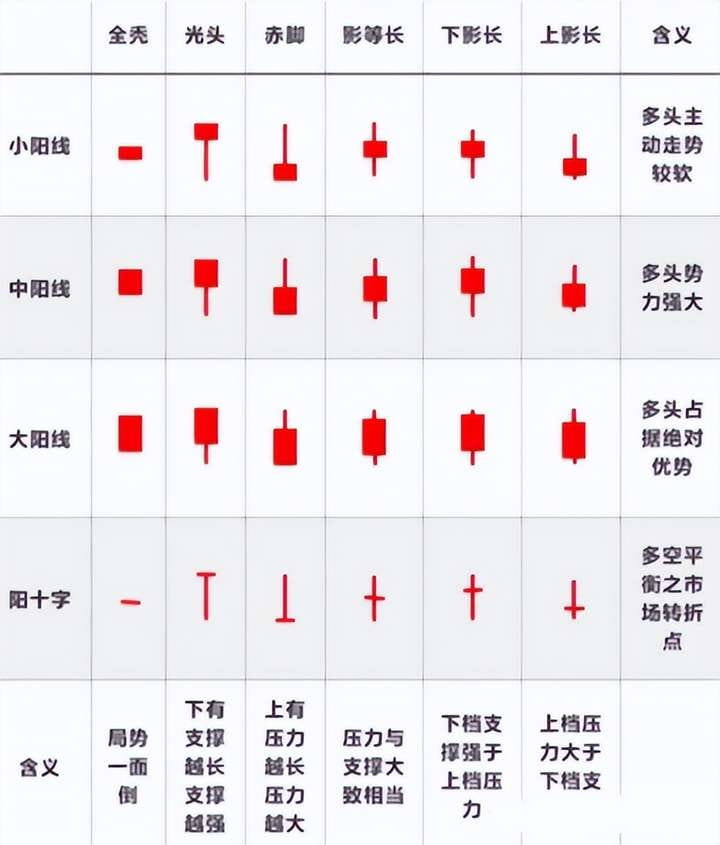
12. Summary of bullish candles.
13. Summary of bearish candles.
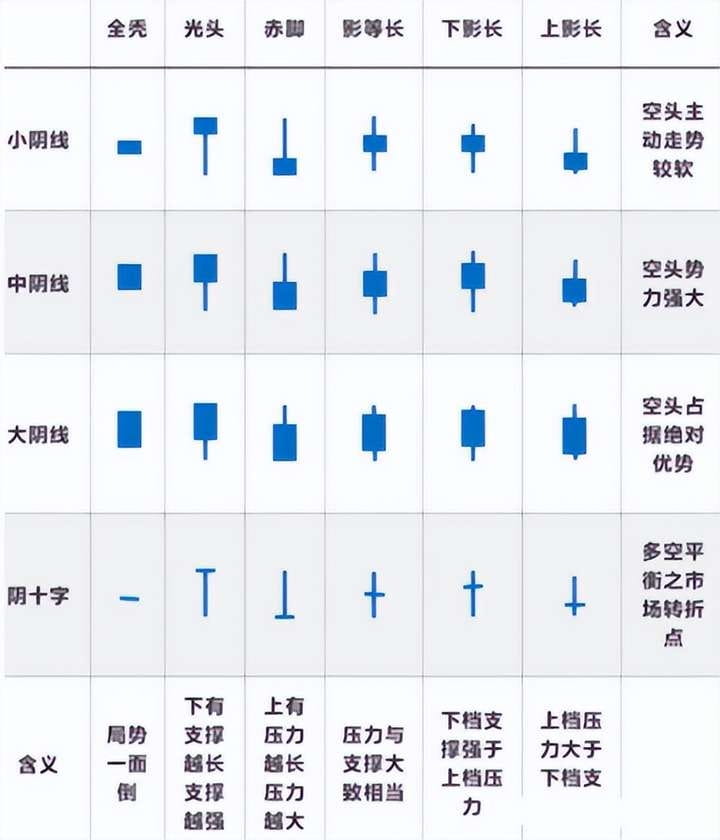
The above is the candlestick chart I have organized for everyone. I hope it can help you.
Note: A large bullish candle releases a strong bullish signal. If one believes the market will rise based on the bullish signal released by the candlestick and buys in, it’s easy to fall into the trap of being lured in.
When learning about candlestick charts, remember these three points: A bullish signal does not equal a bullish market; a bullish outlook does not equal a suitable buying point; a suitable buying point does not equal steady profits.
1. Seize opportunities to build positions for the future, which can help many people leap across classes again in a bull market!
2. Opportunities in altcoin trading will share wave and long-term strategies in real-time!
3. The market is active again, and new star sectors or coins are definitely needed to ignite a new bull market. Catching one can lead to huge profits, catching several can lead to explosive profits!
The last trick is simple and practical, even a beginner can easily profit:
We divide our position into three parts. When the coin price breaks through the 5-day line, we buy one part. When it breaks through the 15-day line, we buy another part. If it breaks through the 30-day line, we buy the last part. This must be strictly followed. If the coin price breaks through the 5-day line but lacks the strength to break through the 15-day line and instead falls back, as long as it does not break the 5-day line, we will hold steady. If it breaks, we will sell immediately.
In the same vein, if it breaks through the 15-day line but lacks the strength to break through the 30-day line, it falls back but does not break the 15-day line, we will continue to hold. If it breaks, we will sell part of it. If it breaks through the 30-day line and then falls back, we will sell in the same way.
When unloading, the opposite is true: when the coin price is high, once it breaks below the 5-day line, sell one part first. If it does not continue to fall, we will hold the rest. If it breaks below the 5-day, 15-day, or 30-day lines, do not hesitate, sell everything, and do not think it will come back.
This method is very simple, but the key is that you have to stick with it. Once you buy, the rules for buying and selling are set, and you must strictly follow the rules to secure profits.
The above are some of Yan An's views and insights. If you find them helpful, you can like and save them. I am Qing Tian, someone who has experienced three rounds of bull and bear markets, skilled in logical coin selection and technical timing, only trading within my cognitive range, with each direction validated by the chart!
Even the most diligent fisherman will not go out to sea during a stormy season but will carefully guard his boat. This season will eventually pass, and a sunny day will come! Follow Yan An, who will teach you both fishing and how to fish. The doors of the cryptocurrency space are always open; only by going with the trend can one have a life that flows with the tide. Save this and remember it in your heart!
