Observation of Price Action:
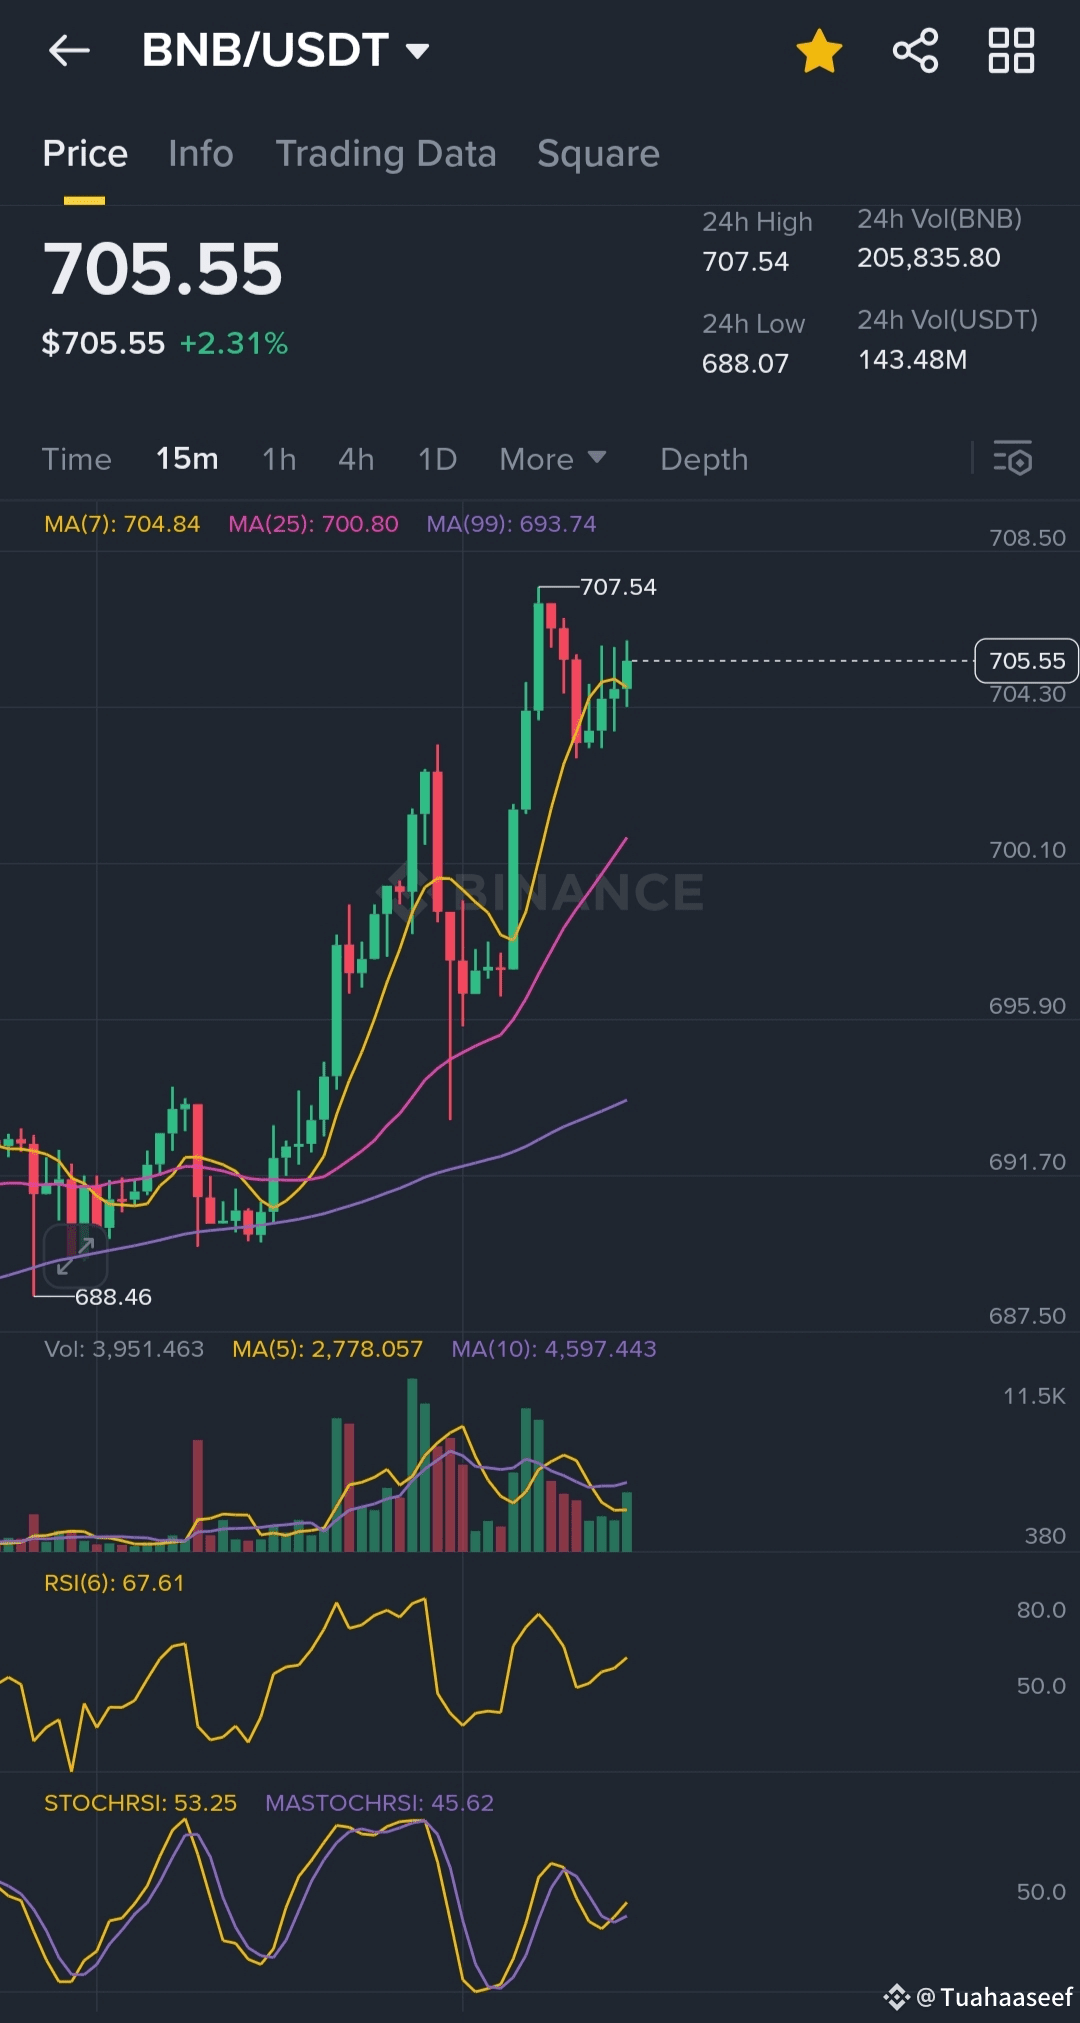
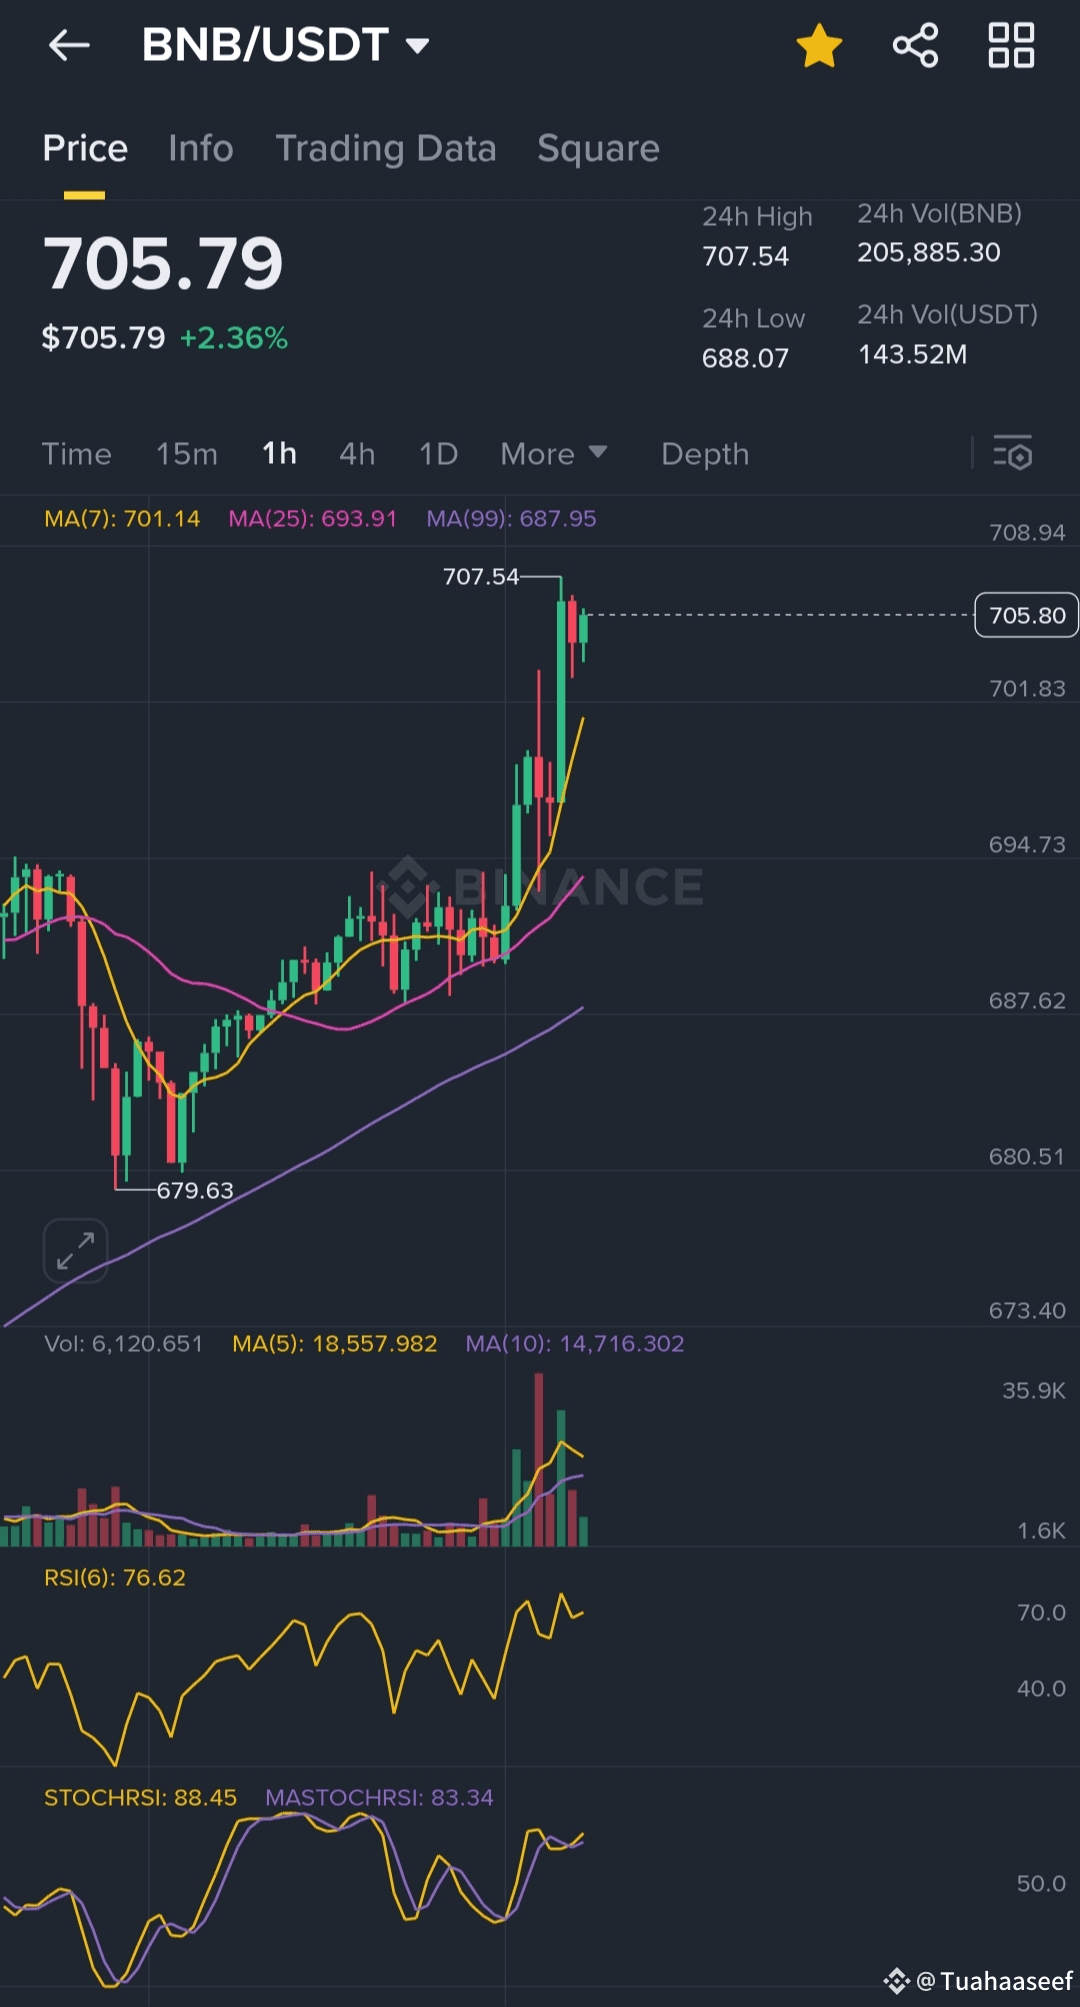
* Strong Uptrend: Across all the provided images (taken within a very short timeframe), BNB is clearly in a strong uptrend, with the price rising from around $679.63 to hitting a high of $707.54 and then consolidating slightly around $705.XX.
* Recent High: The price reached a peak of $707.54 (labeled "707.54" on the chart) and then pulled back slightly. This suggests potential resistance at that level, or at least a temporary pause in the aggressive buying.
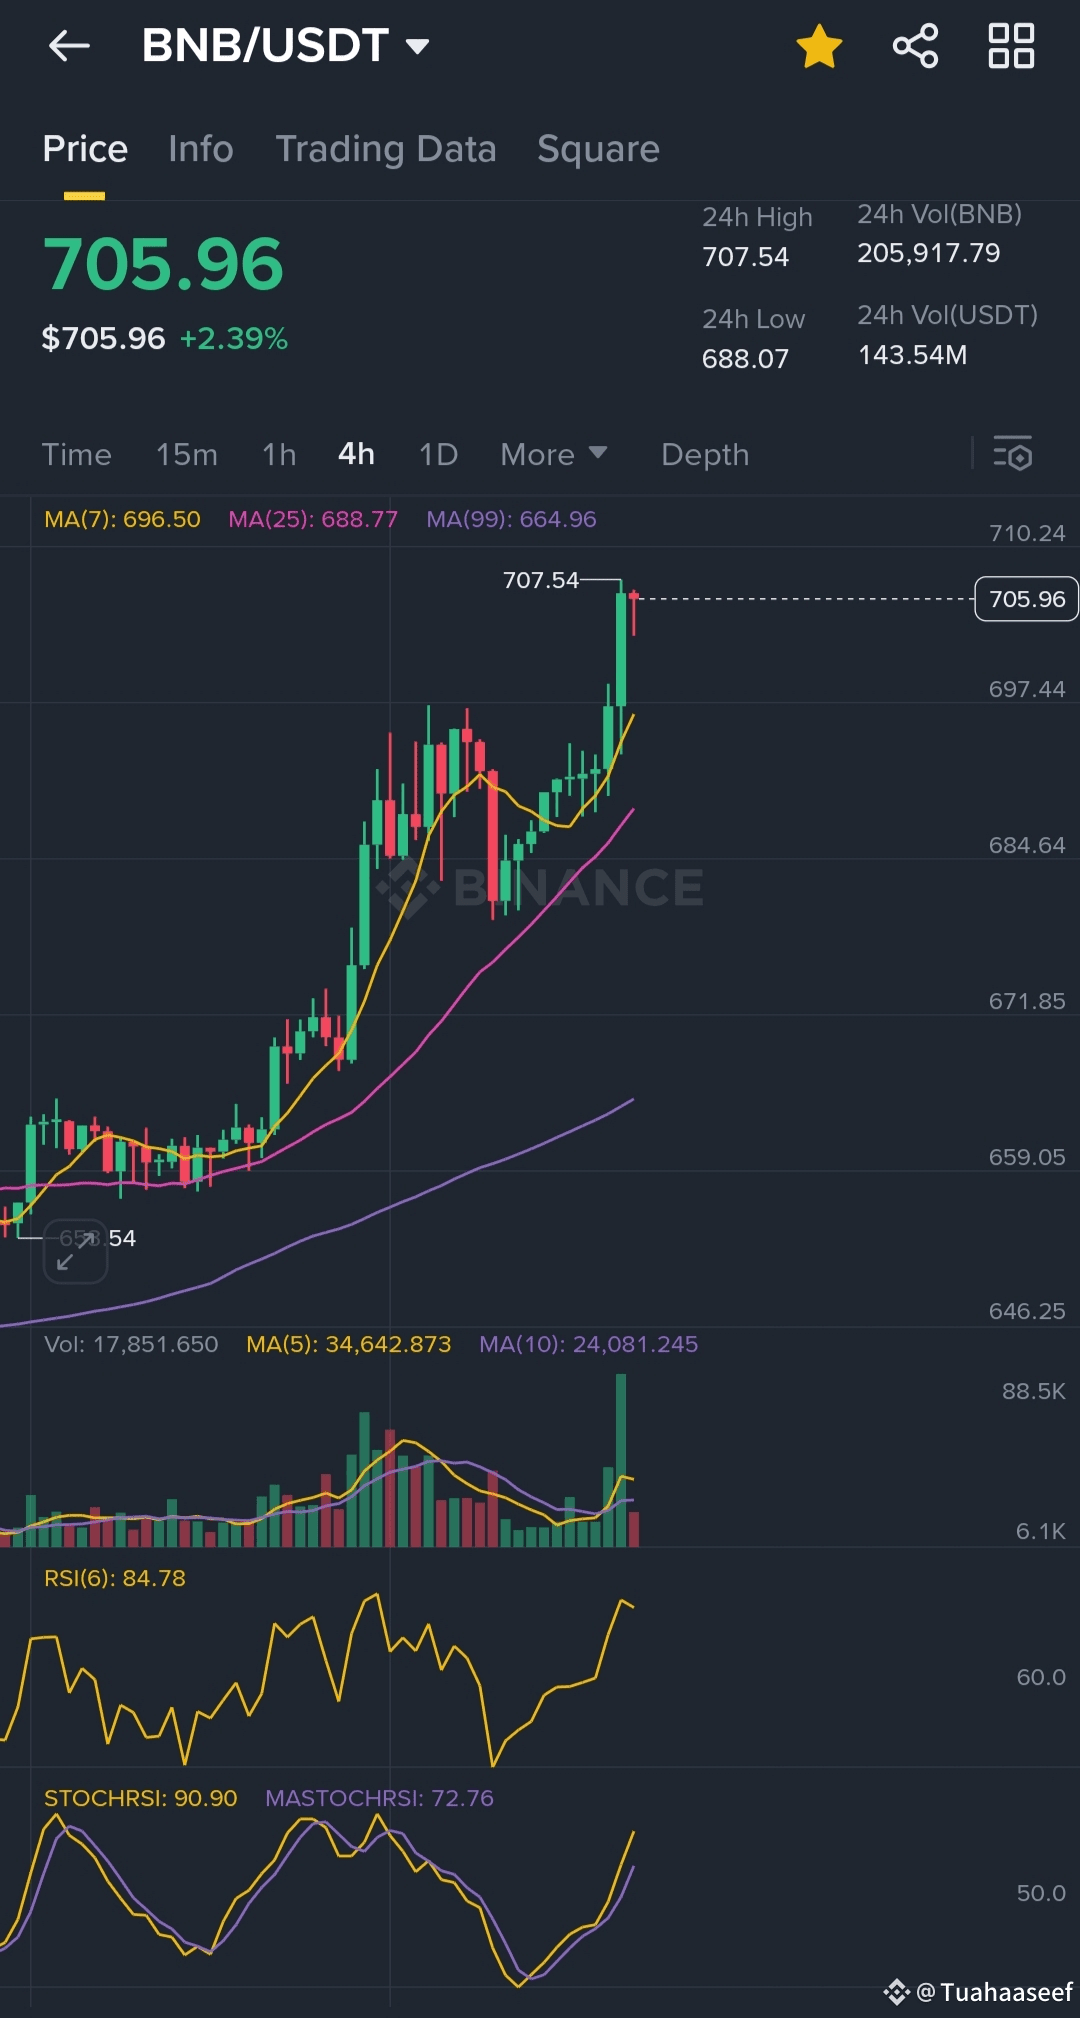
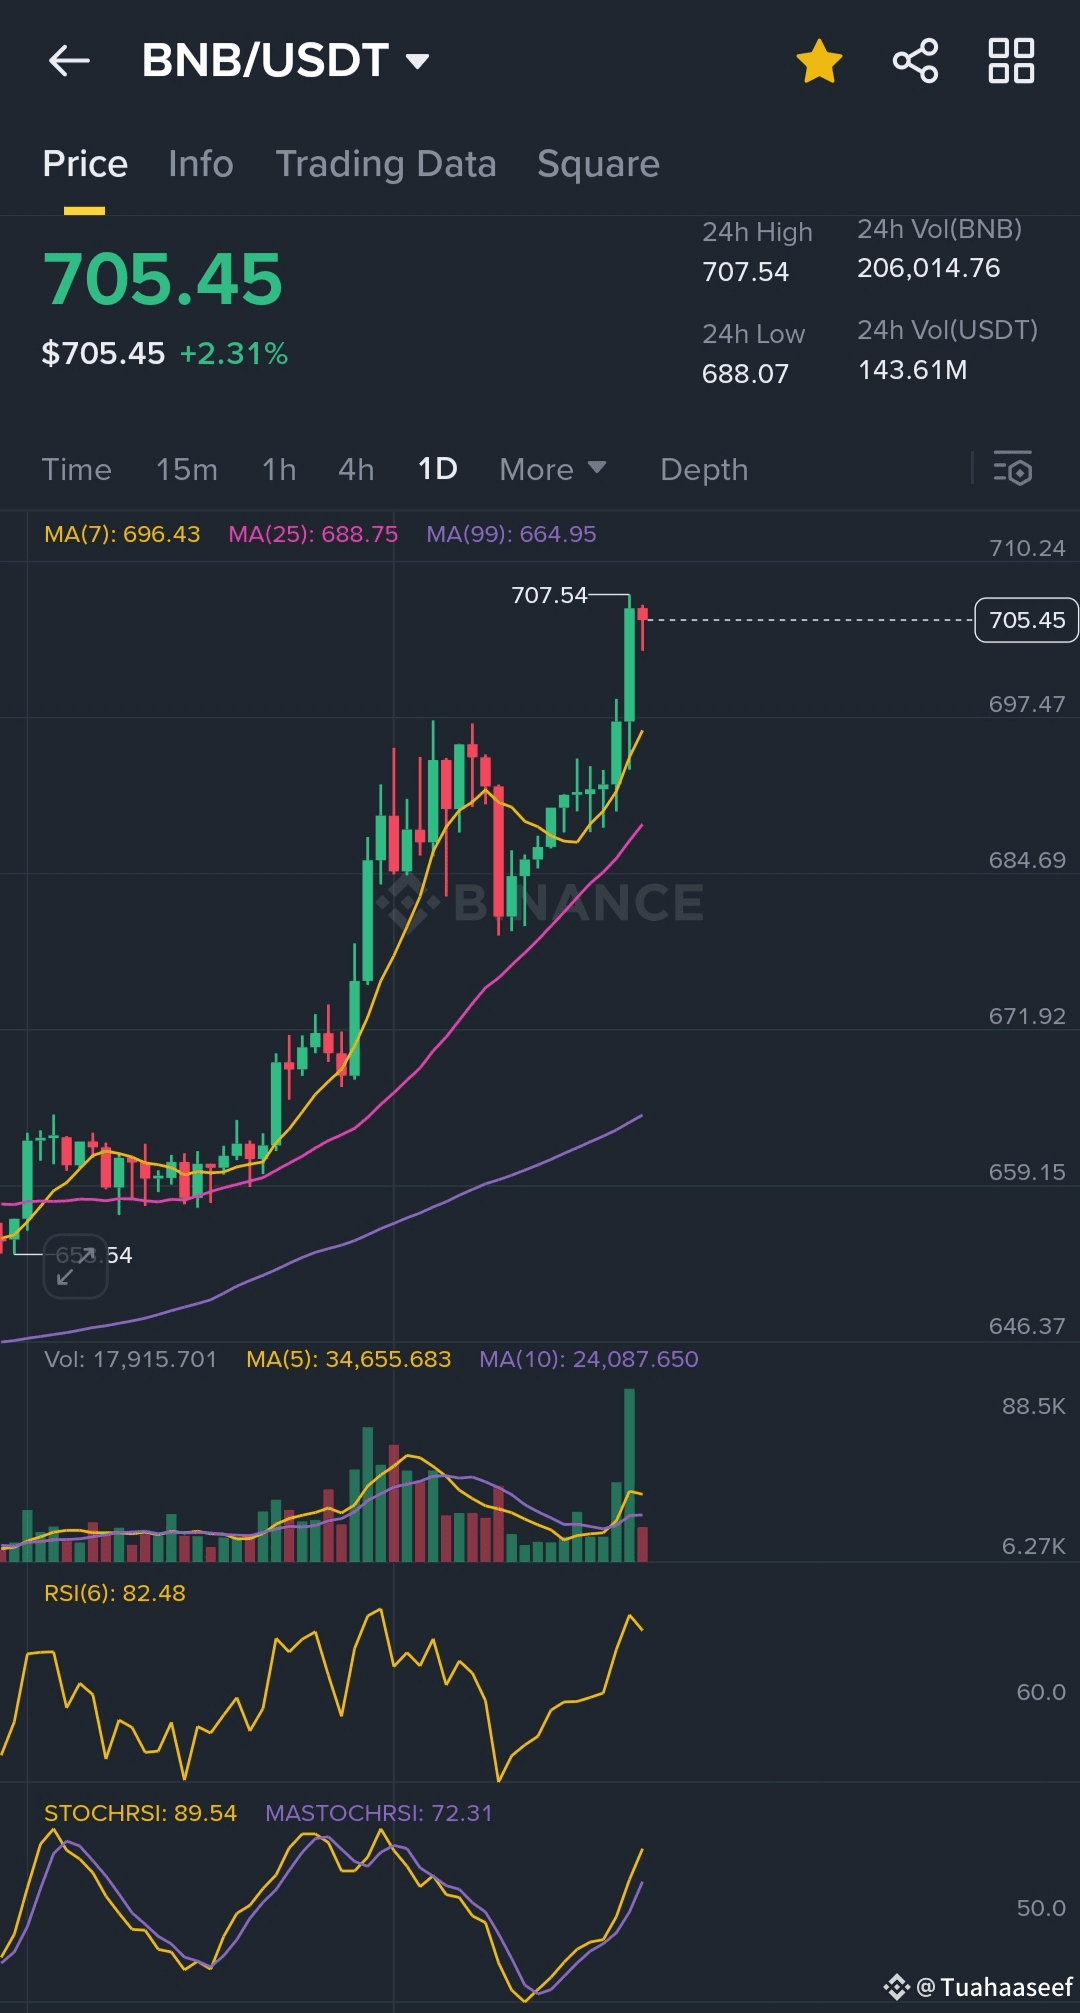
* Candlestick Patterns: In the initial images, you see strong green (bullish) candles, indicating buying pressure. In the later image, there's a red candle forming near the top, which could signal a temporary reversal or consolidation.
Observation of Moving Averages (MA):
* MA(7) (Yellow Line): This is the fastest moving average. In the initial images, the price is well above MA(7), indicating strong bullish momentum. In the last image, the price has come down to touch or slightly below the MA(7), suggesting a potential loss of short-term momentum or a retest of support.
* MA(25) (Purple Line): The price is consistently above MA(25) in all images, which reinforces the bullish trend on a slightly longer timeframe.
* MA(99) (Grey Line): The price is significantly above MA(99), indicating a strong long-term bullish trend.
* Order of MAs (MA(7) > MA(25) > MA(99)): This "golden cross" type alignment (faster MAs above slower MAs) is a classic bullish signal, suggesting the uptrend is intact across different timeframes.
Observation of Volume:
* Increased Volume with Price Surge: The volume bars show a significant increase when the price was making its upward move towards $707.54. This confirms the strength of the move, as strong price movements accompanied by high volume are generally considered more reliable.
* Decreased Volume on Pullback: In the last image, as the price pulls back slightly, the volume appears to be lower compared to the peak buying volume. This could suggest that the selling pressure isn't as strong as the buying pressure was, and it might just be a natural consolidation rather than a major reversal.
Observation of Relative Strength Index (RSI(6)):
* Overbought Conditions: In the initial images, the RSI(6) is very high, ranging from 76.62 to 84.78. An RSI above 70 is generally considered "overbought," meaning the asset may have risen too quickly and could be due for a pullback or consolidation.
* RSI Cooling Off: In the last image, the RSI(6) has dropped to 67.61. This indicates that the asset is no longer as overbought as it was, and some of the immediate buying pressure has subsided. This "cooling off" can sometimes precede another leg up, or it could be part of a larger correction.
Observation of Stochastic RSI (STOCHRSI and MASTOCHRSI):
* Overbought and Potential Bearish Cross: In the initial images, both STOCHRSI and MASTOCHRSI are very high, nearing 90, indicating extreme overbought conditions. In the later images, especially the last one, you can observe the STOCHRSI (blue line) starting to cross below the MASTOCHRSI (orange/yellow line) from overbought territory (e.g., 53.25 / 45.62). This is a bearish signal that suggests momentum is shifting downwards in the very short term, often preceding a short-term price correction or consolidation.
Synthesis and Potential Scenarios for the Next 6 Hours (Based on Technical Observations):
Given these observations, here's an interpretation of potential short-term scenarios for BNB, based purely on the technical information provided:
* Short-Term Consolidation/Pullback: The high RSI and the bearish cross in StochRSI, combined with the price pulling back from its peak and touching the MA(7), strongly suggest that BNB is likely to undergo a period of consolidation or a minor pullback in the very short term (e.g., within the next few hours). This is a natural reaction after such a strong upward move and overbought conditions. The initial resistance around $707.54 might hold for a bit.
*(Looking for Support): The price might seek support at the MA(7) or even the MA(25) if the pullback is stronger. A bounce off these moving averages, especially if accompanied by renewed volume, would be a bullish sign for a continuation of the uptrend.
* Continuation of Uptrend (After Consolidation): Despite the short-term indicators suggesting a pullback, the overall trend (supported by the MA alignments and strong initial volume) remains strongly bullish. If the consolidation is healthy and the price finds support, there's a good chance the uptrend could resume and challenge the $707.54 high again within the 6-hour window or shortly thereafter. The cooling off of RSI could provide room for another upward move.
* Important Levels to Watch (Derived from images):
* Resistance: Around $707.54 (the recent high).
* Immediate Support: MA(7) (around $704.84 in the last image).
* Stronger Support: MA(25) (around $700.80 in the last image). A break below MA(25) might signal a deeper correction.
In summary, based on the provided technical indicators, the immediate outlook for BNB within the next 6 hours leans towards a period of short-term consolidation or a minor pullback after a significant rally and overbought conditions. However, the underlying trend remains strongly bullish, so this consolidation could be a healthy pause before another potential move higher.
Disclaimer: This is purely an interpretation based on the provided technical data and common technical analysis principles. It is NOT financial advice, and actual market movements can differ significantly due to unforeseen news, market sentiment, or other macroeconomic factors. Trading cryptocurrencies carries substantial risk.
