Breakout Trading Strategy:
⸻
🔍 What is a Breakout?
A breakout occurs when the price breaks a key support or resistance level and stabilizes outside of it, often indicating the start of a strong movement in the new direction.
⸻
🛠️ Preferred Tools and Indicators
• Horizontal levels: Support and resistance lines that have been tested multiple times.
• Moving averages (like 50 or 200 day): A price breakout above a moving average may indicate a new trend.
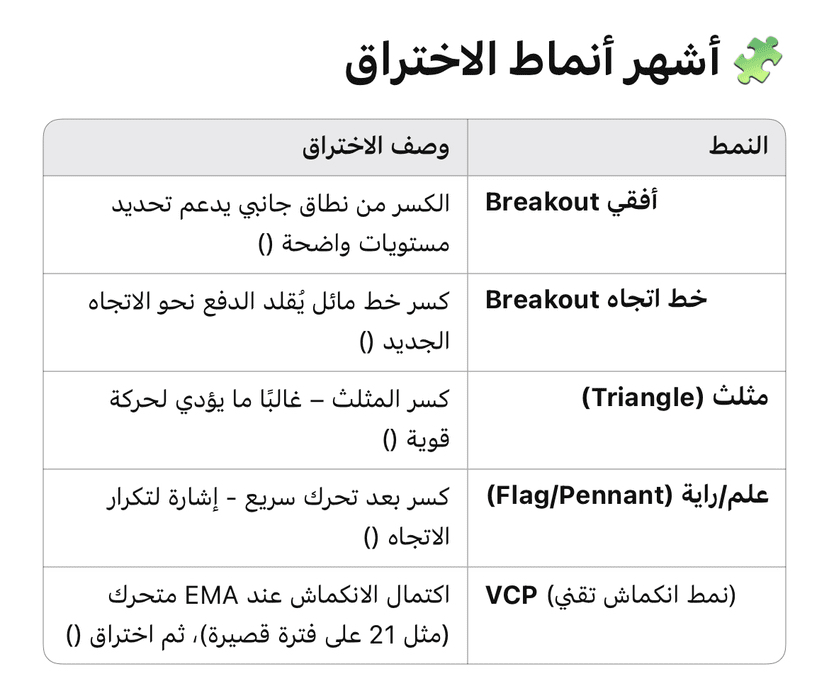
• Charts like continuations and contractions (Flags, Triangles, VCP), which are common patterns in breakout trading.
• Momentum indicators like RSI or MACD; as momentum confirms the strength of the breakout.
• Bollinger Bands: A price reversal outside the range after a period of contraction indicates a potential upcoming breakout.
⸻
🧭 Steps of the Breakout Strategy
1. Identify the breakout level: Draw support/resistance lines or patterns like triangles or flags.
2. Wait for confirmation: It's best to wait for the closing of a candle after the breakout or for high trading volume above the norm.
3. Enter the trade: When closing above resistance (for an upward breakout) or below support (for a downward move).
4. Risk Management:
• Place a Stop-Loss slightly below the broken resistance or above the support for a downward move.
• Control the position size with a risk not exceeding 1-2% of total capital.
5. Set the target (Take-Profit): Often done by measuring the height of the pattern or a risk-reward ratio of 1:2 or 1:3.
⸻
⚠️ Challenges: False Breakouts
• A false breakout is a temporary break followed by a retreat within the range.
• To avoid it, you can:
• Wait for a retest of the previous resistance level as new support before entering.
• Ensure there is high trading volume at the breakout.
• Use additional signals like MACD, RSI, or ensure that the breakout is in sync with the overall market trend.
Advanced tips from the trading community
From participants on Reddit:
Instead of buying immediately upon breakout, wait for the [resistance] level to turn into support.
In weak markets, most movements are sideways… only 15-20% of the time does a trend occur.
✅ Summary of the Process
Effectiveness: A clear and precise strategy; suitable for various timeframes and assets like stocks, forex, and commodities.
Potentially large rewards (trend initiation + increased momentum) with calculated risk.
Risks: False breakouts can lead to quick losses, but using confirmations and the right timeframes reduces these risks.
