People in the crypto space can experience a 50x or 100x increase overnight, but they can also lose everything in an instant.
Trading contracts in the crypto space is thrilling, more exciting than a rollercoaster ride.
Have you ever experienced consecutive losses and frequent liquidations?
Then you feel frustrated and regret your decisions?
Are you eager to recover losses, only to find yourself sinking deeper?
You repeatedly envision success, but reality keeps slapping you in the face?
This is something every trader has gone through; you and I are no exception!
The difference is that some give up under such torment, some lose all their capital, and those who persist are few. But what is the meaning of persistence without a complete understanding?
I have watched countless tutorials, learned a lot from traders' summaries, and analyzed countless reasons for failure! I have summarized the following points, which I believe can help you:
1. Mindset and Emotion Management
Mindset and emotion management does not mean that you cannot be happy when you profit or cannot be frustrated when you lose, nor does it mean becoming a robot without emotions!
Rather, it requires you to firmly believe in your inner self that you will succeed, that the current losses are only temporary, to truly establish a positive belief system. Secondly, when losses occur, you must maintain rationality and a calm mind, avoid blindly placing orders, and be able to analyze correctly and operate rationally, which is crucial!
2. Continuously Improving Trading Systems
Remember, trading is not gambling, but it does have probabilistic attributes. You must continuously summarize and explore a trading system that suits you in long-term trading. Specifically, establish your trading rules in various dimensions such as indicator analysis, position size, take profit and stop loss, and long/short cycles to constrain yourself and determine your trades rather than trading blindly, otherwise you will enter an infinite loop!
3. Capital Management
There is a saying: 'As long as the green mountains remain, one need not worry about firewood.' You must not have a mindset of going all-in; this is very dangerous. Because once you have this thought, in most cases, the market will fulfill it and leave you completely disheartened! You must strictly control this, summarize your maximum consecutive loss count, and manage your capital, ensuring you always have a chance to turn things around. This requires extreme calmness; only with chips left can you have the opportunity to be reborn!
4. Technical Analysis
This is extremely important; if you have no technical knowledge at all, then do not place orders, because that would be gambling. You will definitely fail, which is very scary! Learning technical indicators is a gradual improvement process, but once you overly rely on various indicators for your judgment, you may often find yourself lost in thought, making frequent mistakes, and then doubting the technology. It is crucial to find the indicators that suit you from many options and simplify them. Commonly used indicators include naked candlestick patterns, Bollinger Bands, moving averages, MACD, volume bars, OBV, etc. Understand the essence of simplicity!
In short
Perpetual contracts, also known as perpetual futures contracts, are a type of derivative trading method. Users can use perpetual contracts to go long, short, or arbitrage to achieve trading returns that are many times higher than their initial investment.
Through perpetual contracts, one can earn money not only from the rise in asset prices but also from the decline, and leverage can be used to amplify returns with a small amount of capital.
When trading perpetual contracts, if the price trend is incorrectly predicted, one may face liquidation, resulting in the risk of losing the entire investment principal.
Whether you are a novice investor or experienced in cryptocurrency trading, reading this article will give you a deeper understanding of perpetual contracts.
The Principle of Perpetual Contracts
The underlying logic of perpetual contracts is: it allows investors to borrow virtual currencies to buy or sell virtual currencies at a specific price at a specific future time.
For example, if Little Fish has 100 USDT and believes that the price of Bitcoin will rise from 100 to 200 tomorrow, then Little Fish can borrow 900 USDT from the exchange and use this 1000 USDT to buy 10 Bitcoins. When the price rises to 200 tomorrow, he can sell them. After selling, Little Fish will have 2000 USDT, and after repaying the 900 USDT borrowed from the exchange, the profit from this transaction is 1000 USDT.
If Little Fish only used his original 100 USDT capital to trade, then the profit would only be 100 USDT. So in this example, Little Fish used 10 times leverage to earn 10 times the profit.
However, if Little Fish predicts the price direction incorrectly and the price of Bitcoin drops to 50 the next day, then the 10 BTC he holds will only be worth 500 USDT, resulting in a nominal loss of 500 USDT. Therefore, trading perpetual contracts with leverage can both amplify profits and amplify losses.
Why is it called a 'contract'?
The contract trading of virtual currencies is derived from traditional commodity futures trading. In traditional futures trading, traders must actually sign contracts when going long or short on the price of a commodity in the future, which is why it is called 'contract' trading.
For example, if McDonald's predicts that potato prices will rise significantly next June, they will sign a futures contract through the exchange for potatoes to be delivered next June. Regardless of the price of potatoes at that time, they will purchase a batch at an agreed price.
In this way, regardless of how potato prices fluctuate, McDonald's can purchase potatoes at a stable price, ensuring a stable supply of fries. If market prices rise, McDonald's can still buy at the contract price, saving costs. Conversely, if market prices fall, although McDonald's must pay the contract price, the actual total cost for the business will also be lower. In fact, international companies like McDonald's do use futures contracts in real life to ensure supply stability and controllable costs.
However, when these commodity futures contracts were derived into virtual currency trading, exchanges borrowed the operational methods of futures contracts but do not actually lend money or coins to you. Instead, they use similar calculation methods to intuitively inform you of the leverage multiplier, expected profits, or losses, lowering the barrier to entry for contract trading and making it accessible for more investors.
What types of contracts are there?
Perpetual Contracts: Perpetual contracts have no expiration date, and users can hold them indefinitely and close them at their discretion.
Delivery Contracts: Delivery contracts have specific delivery dates, including weekly, bi-weekly, and quarterly contracts. Upon reaching the delivery date, the system will automatically settle regardless of profit or loss.
USDT Margin Contracts: These require you to use stablecoin USDT as collateral. As long as you have USDT in your account, you can engage in contract trading across multiple cryptocurrencies, with profits and losses settled in USDT.
Coin-Margined Contracts: These use the underlying cryptocurrency as collateral. You must hold the corresponding cryptocurrency before trading, and profits and losses are settled in that cryptocurrency.
The Most Stable Way to Trade in the Crypto Space
Choose the right coin and be a good person. As a leveraged trader, volatility can be amplified by leverage, so the primary consideration during trading should not be volatility but certainty.
Trade strong coins in an uptrend, and conversely, short weak coins in a downtrend.
For example, at the beginning of a new quarter, the strongest rising coins are EOS and ETH, while the best buy options during a pullback are these two coins. In a downtrend, Bitcoin is the first choice for shorting; even if the final result shows that the mainstream coins fall more than Bitcoin, only shorting or chasing after Bitcoin can greatly avoid the risk of violent rebounds.
Most crypto traders are short-term traders, and during trading, it is challenging to hold out for ideal exit points. They are often not very proficient in position control and cannot rely on fluctuations to adjust their average price. In this case, for most traders, a good entry price outweighs everything.
Once profitable, take some off the table to secure your gains, and set a stop loss at the break-even point for the remaining portion. This is something I have always emphasized in my community.
The Essence of Contract Trading Strategies
(1) Identify the main trend and trade in the direction of the trend; otherwise, do not enter the market.
(2) If you are trading with the trend, your entry points should be:
1. A new breakout point in the trend;
2. A breakout point from a sideways consolidation trending in a certain direction;
3. A pullback point in an uptrend or a rebound point in a downtrend.
(3) Trading with the trend will bring you substantial profits; never exit early.
(4) If the entry point aligns with the larger trend, and the paper profits confirm you are correct, pyramid-style scaling can be employed.
(5) Maintain your position until the trend reverses before closing.
(6) If the market trend goes against your entry, stop loss and exit quickly.
In addition to adhering to the above strategies, remember these three qualities: discipline, discipline, and still discipline!
The way of trading is to accumulate small gains, with compound interest being king. If you deviate from your costs, you must resolutely avoid turning back into losses. If you gain, be sure to secure part of the profits to prevent losing it all. In summary: if you make a profit, act boldly, and for the remaining part, set a stop loss at your original cost.
Tips for Making Money with Perpetual Contracts
1. Avoid going all-in.
How should funds be allocated? Fund allocation should be understood from two levels:
First, from the risk perspective, clearly define the maximum losses your account can or is prepared to endure. This is the foundational thought for fund allocation. Once this total amount is determined, consider how many times you can afford to lose to the market in a row before you are willing to admit defeat.
In my opinion, the riskiest method should also be divided into three parts. That is, you should give yourself at least three chances. For example, if the total account balance is 200,000, and the maximum loss you are allowed is 20% (40,000), a suggested risky loss scheme would be: first 10,000, second 10,000, third 20,000. I believe this loss scheme has a certain rationality because if you get one right out of three, you can profit or at least survive in the market. Not being kicked out of the market is itself a form of success, which means you have a chance to win.
2. Grasp the overall market trend.
Trends are much harder to trade than sideways movements because trends involve chasing highs and cutting losses, requiring a strong resolve in holding positions, while buying high and selling low aligns with human nature.
Trading is more challenging when it aligns with human nature because that is when one fails to make money. It is precisely because it is difficult to trade that profits can be made.
In an upward trend, every violent pullback should be an opportunity to go long. Do you remember what I said about probability? So if you're not in the trade or have exited, patiently wait for a 10-20% drop to buy boldly.
3. Set profit and loss targets.
Setting profit and loss targets can be said to be key to profitability. In several trades, we need to ensure that total profits exceed total losses. Achieving this is not difficult; just follow these points:
① Each stop loss ≤ 5% of total capital;
② Each profit > 5% of total capital;
③ Total trading win rate > 50%.
If the above requirements are met (profit-loss ratio greater than 1 and win rate greater than 50%), profits can be achieved. Of course, you can also have a high profit-loss ratio with a low win rate or a low profit-loss ratio with a high win rate. Anyway, just ensure that total profits are positive; total profits = initial capital × (average profit × win rate - average loss × loss rate).
4. Avoid excessive and frequent trading.
Since BTC perpetual contracts trade 24/7, many novices trade every day, almost every trading day of the month, saying: 'How can you walk by the river without getting your shoes wet?' The more you operate, the more likely you are to make mistakes, and after making mistakes, your mindset deteriorates. Once your mindset deteriorates, you may act impulsively and choose 'revenge' trading: possibly going against the trend or over-leveraging. This will lead to a sequence of mistakes, easily resulting in significant losses that may take years to recover.
5. The timing of entering contracts.
Many respondents open positions 24 hours a day, which is almost equivalent to giving away money. The purpose of contracts is to make stable profit strategies under controllable risks and relatively stable indicators, not to buy at 100x leverage and become rich! Thus, the timing of entering contracts is crucial!
⑴: Avoid opening positions during periods of significant good or bad news, as the market is very chaotic at these times. Spot prices can fluctuate rapidly between 1-3%, making it easy to be caught off guard by market movements.
⑵: I generally choose to enter after the second dip or rise following significant volatility, as market fluctuations tend to stabilize after the second wave. The risk factor is lowest in subsequent ranges. The aim of contracts is to develop the most suitable strategies within the smallest risk range.
⑶: Only enter positions within the indicator range. As long as the indicator parameters do not meet your expectations, do not open positions. This can be understood as entering within your strategy range and ignoring market movements until reaching your psychological price point. Because while contracts amplify leverage, risk factors also increase, so self-discipline is very important.
In summary, when the market stabilizes and indicators align, the risk rate can be reduced by 50%, making it possible to trade.
Disadvantages and Risks of Perpetual Contracts
Liquidation Risk
Liquidation occurs when the losses in a position reach a certain level, causing the margin to be insufficient to support the position. The exchange will automatically liquidate the position to protect both itself and other traders' interests.
As mentioned earlier, the underlying logic of contract trading is actually leveraged borrowing. For example, if Little Fish has 100 USDT in investment capital and uses 10x leverage to open a BTC long position worth 1000 USDT, if the price of Bitcoin is 100 USDT at that moment, the essence of this position is borrowing 900 USDT to buy 10 BTC. The goal is to sell after the price rises.
However, if the price of Bitcoin drops to 90 USDT, then the 10 BTC held will only be worth 900 USDT, exactly the amount borrowed. If the price continues to fall, the value of these 10 BTC will drop below the borrowed amount. The exchange will not allow itself to incur a loss, so when the price of Bitcoin drops by 10%, to 90 USDT, the exchange will liquidate Little Fish's position, which is what we refer to as 'liquidation.'
After liquidation, users not only lose their profits but also the margin (capital) used to open the position. Additionally, the higher the leverage used, the easier it is to get liquidated. In the above example, using 10x leverage means a 10% adverse price movement will lead to liquidation; using 100x leverage means a 1% adverse movement will lead to liquidation.
The above example calculates liquidation at a 100% loss, but in actual trading, each exchange calculates the percentage of liquidation loss differently, with some using 90%. Therefore, in specific trades, it is more accurate to refer directly to the liquidation price provided by the exchange.
Spike Risk
A spike refers to a sudden and extreme fluctuation in the market that quickly returns to normal levels. This situation may trigger stop-loss orders or cause liquidations, leading to investor losses. Spikes can result from insufficient liquidity on the exchange or malicious market manipulation.
Funding Rate Erosion
As mentioned earlier, exchanges require users holding perpetual contracts to pay a funding rate every 8 hours. Although each time it is only 0.000x%, if the position held is large and held for a long time, the cumulative funding rate can become a significant expense.
Contract risks are high; trading requires caution!
When combined with the MACD indicator, the win rate can reach 70%, helping to avoid liquidation!
Playing in the crypto space is essentially a battle between retail investors and institutional investors. If you lack insider information and first-hand data, you are bound to get 'cut off'! If you want to collaborate on layouts and harvest together from institutional investors, you can follow (Public Account: Trend Prediction). Like-minded crypto enthusiasts are welcome to discuss together!
MACD Practical Mantras:
1. When MACD is above the zero axis, every time a golden cross occurs, the coin price is about to reach a new high.
2. When MACD is below the zero axis, every time a dead cross occurs, the coin price is about to reach a new low.
3. A golden cross below the zero axis indicates a rebound in a downward trend; wait until it crosses above the zero axis to participate.
4. A golden cross above the zero axis indicates an upward trend; you can buy at a high price and sell at a low price until a divergence occurs. When MACD shows a small sell signal and the coin price rises, a subsequent red candle that does not exceed the previous high will lead to a decline.
6. A small buy signal in MACD indicates that the coin price is declining or stabilizing. If the subsequent green candle does not exceed the previous low, it will rise.
7. MACD shows a contraction at a high level: after a sharp rise in coin prices, if the MACD moves away from the zero axis and the red candles shorten, exit quickly.
8. A low golden cross occurs when the coin price has dropped significantly, and once the MACD moves away from the zero axis, it will surely rise; if a second golden cross appears, the rise will be even more significant.
9. MACD Golden Pit: After a wave of price increase, if there is a pullback, and within 7 days after a dead cross, the green candle is shorter than before, followed by a golden cross, it indicates a rise.
The MACD indicator plays a crucial role in technical analysis and is an essential part of learning technical analysis. Its importance includes the following points.
1. The MACD indicator is one of the most effective technical indicators verified by historical trends and is widely used.
2. The MACD indicator is derived from the EMA moving average indicators and is very effective in capturing trending markets. Trend investors basically reference this indicator in practice.
3. The top and bottom divergences of the MACD indicator are recognized as one of the best methods for 'bottom fishing and escaping tops'. This method is a key tool in solidifying trend theory and wave theory.
4. Many veterans have experienced this: when they first entered the market, they learned the MACD indicator, then slowly abandoned it. After a long period of learning and comparison, especially after practical testing, they eventually returned to using the MACD indicator. This shows the uniqueness of this indicator.
5. The application of the MACD indicator in quantitative trading is also extremely widespread.
Because of these advantages, the MACD indicator has become the most commonly used technical indicator by professional traders.
The Concept and Calculation of the MACD Indicator
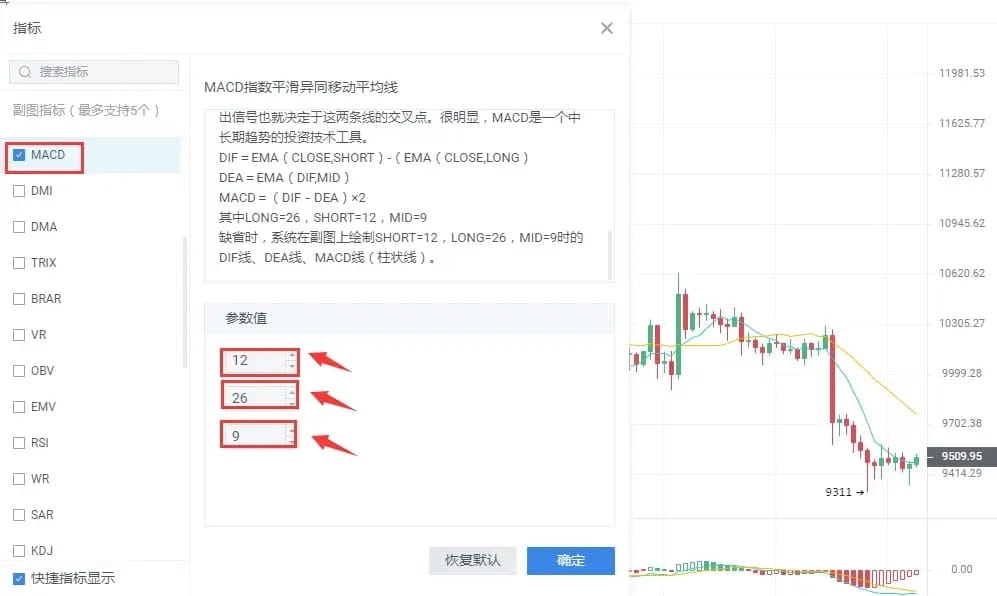
The MACD indicator, or Moving Average Convergence Divergence, was created by Gerald Appel and is a technical analysis tool used to track price trends and determine K-line buy and sell opportunities. This indicator is a common feature in market analysis software and is known as the 'King of Indicators'. As shown in [Figure 1].
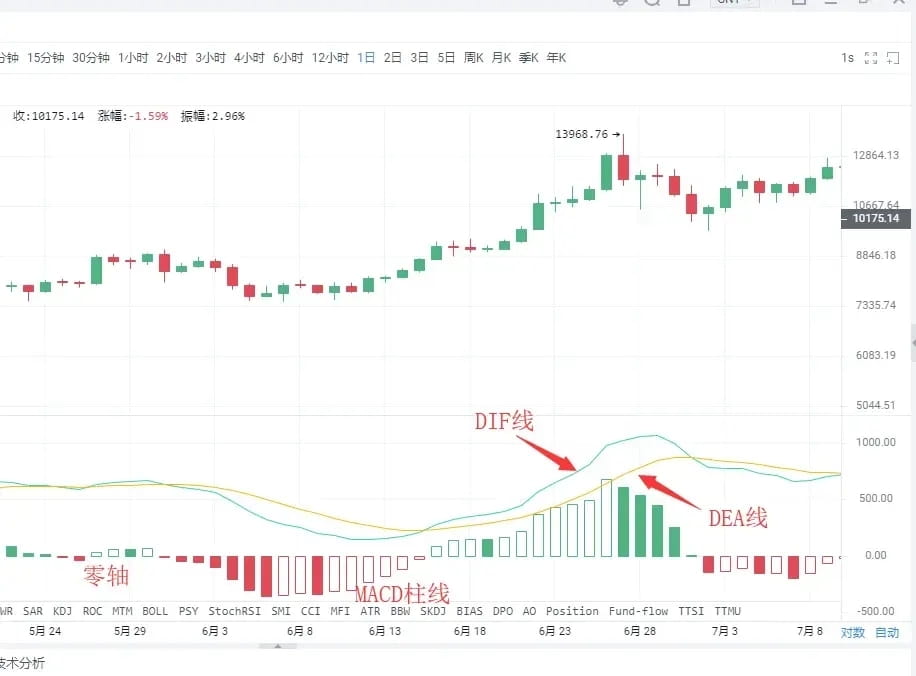
The MACD indicator consists of the DIF fast line, DEA slow line, MACD histogram, and the zero axis, collectively known as 'three lines and one axis.' Investors analyze price movements through the intersections, divergences, breakouts, support, and resistance of these elements. The MACD indicator has become the preferred indicator on many market analysis software, demonstrating its widespread application, which also indicates that this indicator is one of the most effective and practical indicators verified by history.
MACD Golden Cross and Dead Cross
The 'Golden Cross' and 'Dead Cross' formations are extremely important shapes in technical indicator analysis. The golden cross formation indicates a short-term buying opportunity, while the dead cross formation indicates a short-term selling opportunity.
The dead cross formation, also known as the death cross, occurs when the shorter-term indicator line crosses downward through the longer-term indicator line, typically indicating a short-term selling opportunity. If the dead cross occurs after a consolidation phase in a downward trend, it is a more reliable sell signal.
After understanding the golden cross and dead cross formations, we can look specifically at the MACD indicator's golden cross and dead cross. The occurrence of golden and dead crosses in different positions reflects different market meanings.
Situation 1: Buy point at a low golden cross
If the position of the golden cross between the DIF line and DEA line appears below the zero axis and is far from it, this golden cross is called a low golden cross. Investors can view this golden cross as only a short-term price rebound; whether the K-line can form a real reversal still requires observation and confirmation with other indicators.
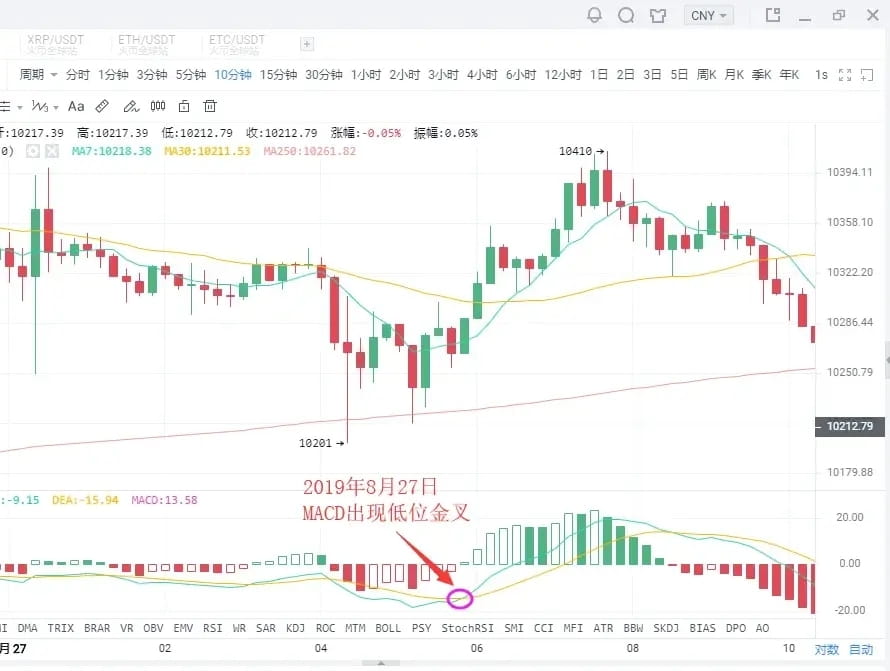
As shown in the image:
On August 27, 2019, in the BTC 10-minute K-line chart, a low golden cross appeared as the price retraced, followed by a rebound of $200. Short-term investors can seize the opportunity to enter.
Situation 2: Buy point at a golden cross near the zero axis.
If an upward trend has formed, and the golden cross between the DIF line and DEA line occurs near the zero axis, this is often an excellent buying opportunity for investors.
This is because once an upward trend forms, a golden cross near the zero axis indicates that the correction has thoroughly ended, and a new wave of upward movement has begun. If this is accompanied by a golden cross of the volume line, it indicates that the price increase is supported by trading volume, making the buy signal even more reliable.
Once this buy point appears, investors must not miss it; otherwise, they will miss out on significant price rises.
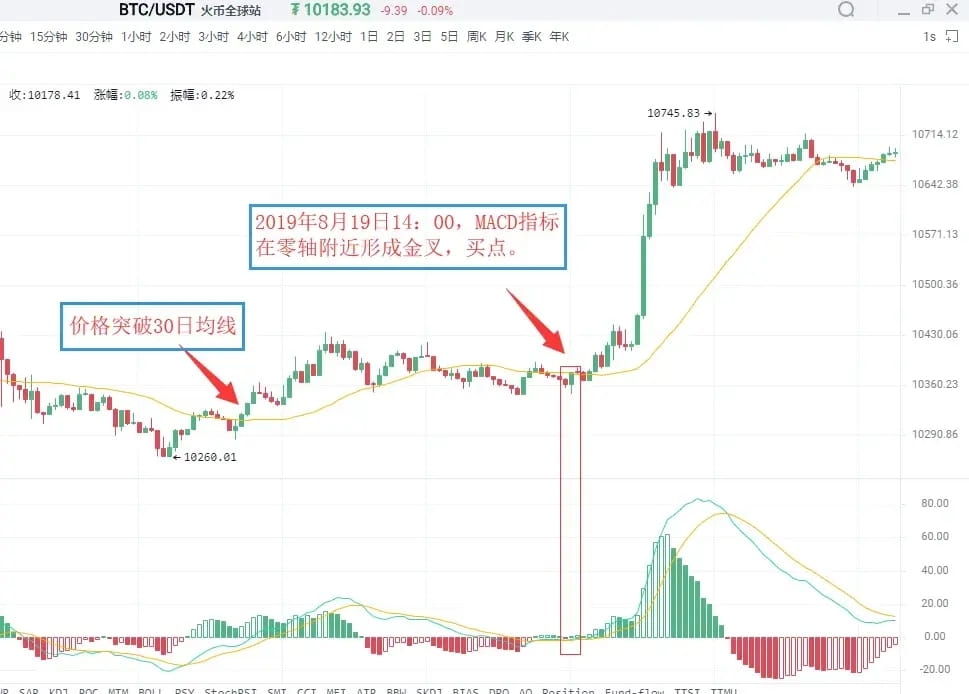
As shown in the image:
On August 19, 2019, at 09:30, in the BTC 5-minute K-line chart, Bitcoin broke above the 30-day moving average, indicating that the upward trend has initially formed. Afterward, the price remained above the 30-day moving average for a significant period.
On August 19, 2019, at 14:00, the MACD indicator formed a golden cross near the zero axis, indicating that the market is about to experience a substantial upward movement. Investors can decisively buy in.
Situation 3: Buy point at a high golden cross.
If the golden cross between the DIF line and DEA line occurs above the zero axis and is far from the zero axis, this golden cross is referred to as a high golden cross. High golden crosses generally appear during consolidation within an upward price movement, indicating that the consolidation has ended and the K-line is about to resume its previous upward trend. Therefore, when a high golden cross appears, it serves as a strong buy signal for adding positions.
In practice, when an upward trend has formed, and the K-line rises slowly and continues for a long time, when the MACD indicator forms a high golden cross, it often indicates that the K-line is about to accelerate its upward movement.
This is why high golden crosses can also be used for swing trading. Investors can utilize the MACD indicator to consistently target upward swings during an upward trend.
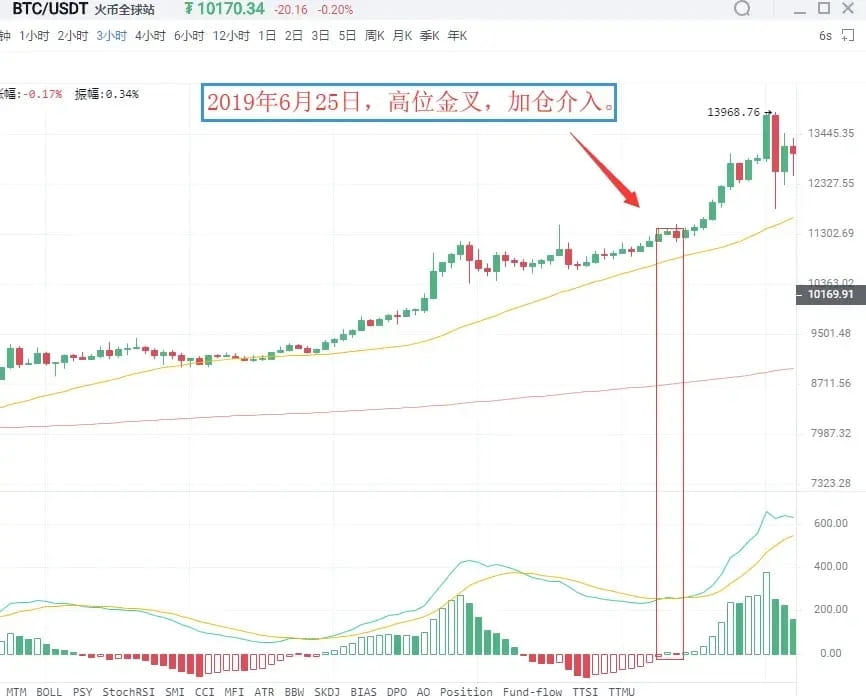
As shown in the image:
On June 25, 2019, in the BTC 3-hour K-line chart, the price of Bitcoin was in an upward trend, and after a consolidation, it rose again, while the MACD indicator showed a high-level golden cross. This indicates that the pullback has ended, and the price will continue the previous upward trend. Investors should pay attention to seizing this opportunity to add positions.
Situation 4: Sell point at a low dead cross
A low dead cross occurs when it happens far below the zero axis. This type of low dead cross often appears at the end of a rebound in a downward trend, indicating the end of the rebound and serving as a sell signal. At this point, investors who are not in the market should wait and observe, while those who are deeply trapped can sell first and buy back after the price falls to lower their costs.
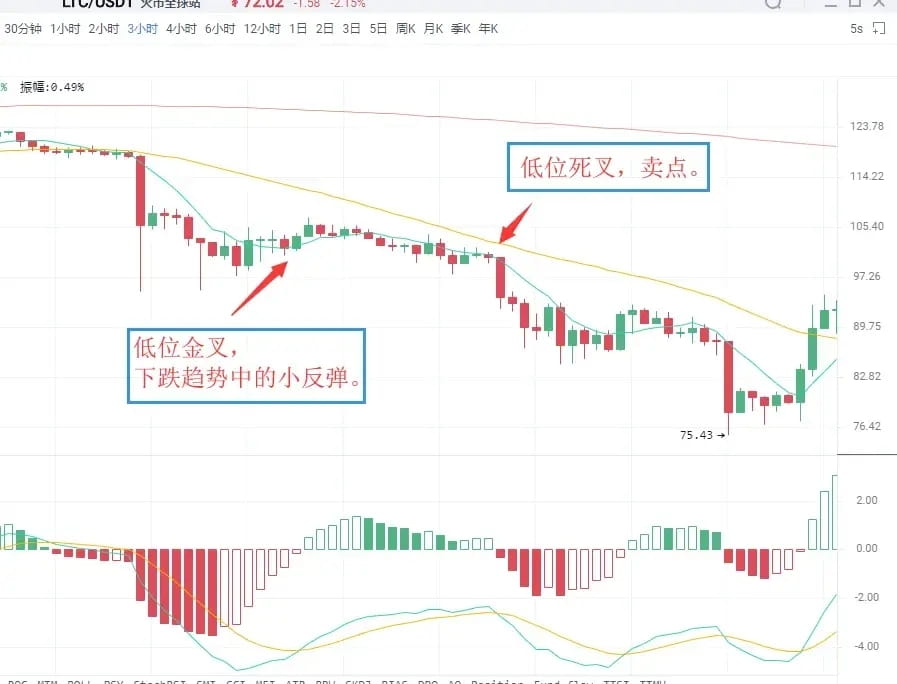
As shown in the image:
On July 14, 2019, in the LTC 3-hour K-line chart, the MACD indicator showed a low golden cross, and the price experienced a slight rebound, followed by a quick decline.
Subsequently, the MACD indicator showed a dead cross below the zero axis, and the K-line began a new downward movement. Spot investors can sell positions at the dead cross point and then buy back to lower the holding cost.
Situation 5: Sell point at a dead cross near the zero axis.
If the previous market direction has been a downward trend, the crossing of the DIFF line breaking below the DEA line near the zero axis is called a dead cross near the zero axis. It indicates that the market has accumulated considerable downward momentum near the zero axis, and the appearance of a dead cross signals that downward momentum is beginning to release. The K-line is expected to continue its previous downward trend, serving as a sell signal.
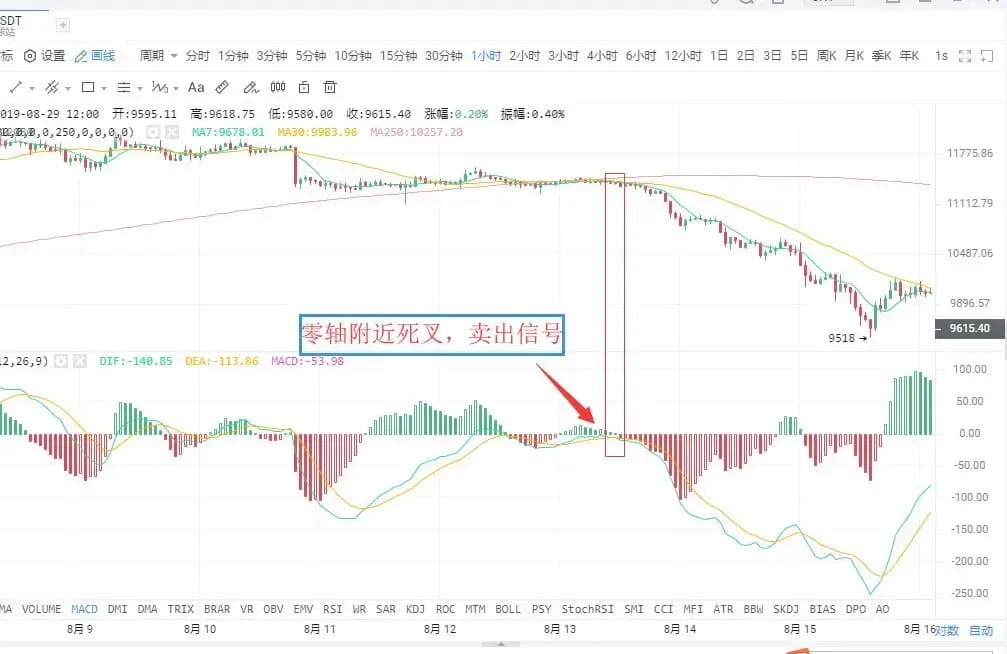
As shown in the image:
On August 12, 2019, in the BTC 1-hour K-line chart, the DIFF line broke below the DEA line near the zero axis, forming a dead cross. This indicates that the market's downward momentum is starting to release, signaling a sell. Investors should decisively sell their positions; otherwise, they will be deeply trapped.
Situation 6: Sell point at a high dead cross
A dead cross formed when the DIFF line breaks below the DEA line at a distance above the zero axis is called a high dead cross. This type of death cross pattern is sometimes accompanied by a MACD divergence. The manifestation is that the price continues to create new highs during an upward movement, but the MACD's DIF line and DEA line do not continue to rise or attack, instead diverging from the price trend, gradually moving downwards.
Above the zero axis, the downward crossing of the DIF line through the DEA line forms a downward cross trend, which is a dead cross and a relatively reliable sell signal.
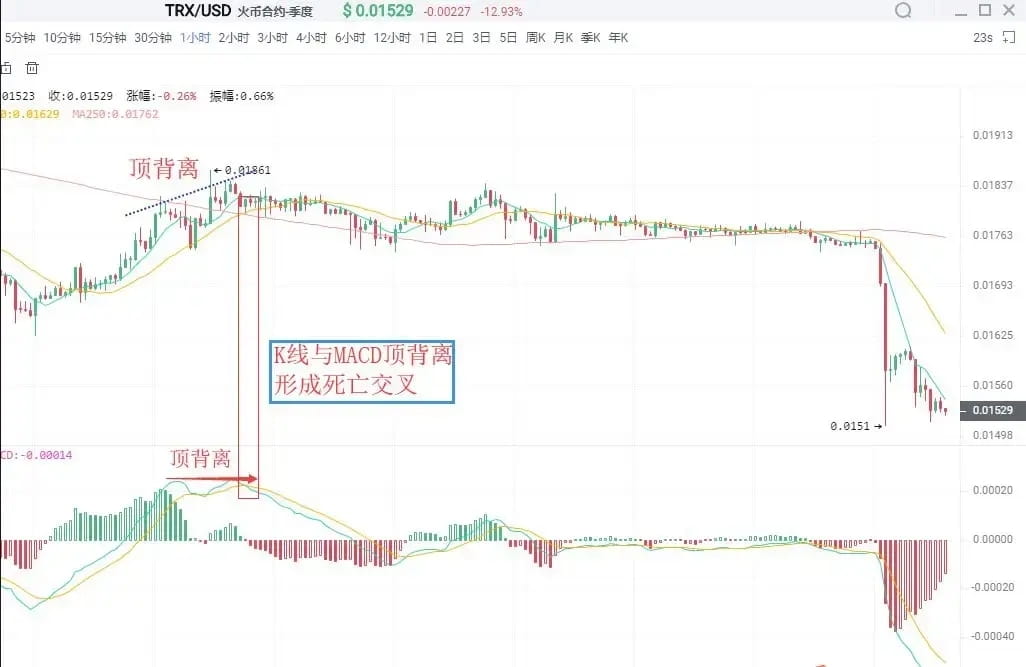
As shown in the image:
On August 23, 2019, in the TRX 1-hour K-line chart, after a wave of increases, the price continued to reach new highs, but the DIF line and DEA line did not continue to rise, forming a death cross and signaling a sell.
Divergence between MACD and K-line
Divergence is a term used in physics to describe momentum. In technical analysis, it is a widely used analysis method with a high success rate. In a downward trend, when the price reaches a new low while the indicator line does not, it is called a bottom divergence, indicating that upward momentum is accumulating, serving as a buy signal. In an upward trend, when the price reaches a new high while the indicator line does not, it is called a top divergence, indicating that downward momentum is accumulating, serving as a sell signal.
I. Bottom Divergence
(1) Bottom divergence between the MACD histogram and the DIFF line.
The bottom divergence between the DIFF line and price occurs in a downward trend when the price reaches a new low and the DIFF line does not. It indicates that the DIFF line's decline is less severe than the price's decline, and upward momentum is accumulating, suggesting a price stop and a higher probability of subsequent increases.
The MACD histogram is the MACD bar hidden behind the DIFF line, divided into red and green. Its divergence from the price is an important application of the MACD indicator, widely used in practice. The bottom divergence between the MACD histogram and price occurs when the price continuously reaches new lows while the MACD histogram does not drop to new lows. Upward momentum is accumulating, and the price is expected to stop declining, with a higher probability of subsequent increases.
When a bottom divergence occurs, investors can identify specific buy points through two methods.
(2) Specific Buying Timing
The bottom divergence of the DIFF line, MACD histogram, and price is not a specific moment but rather a pattern that appears over time. However, the specific timing for buying must be precise, indicating that the price is about to stop declining. Therefore, to capture specific buying opportunities when a bottom divergence occurs between the DIFF line, MACD histogram, and K-line, investors must combine the bottom divergence signals with other technical analysis tools to clarify the buy points.
First: Histogram color change or MACD golden cross.
A change in histogram color indicates that upward momentum has begun to take precedence. Generally, this follows a 'shortened histogram.' Although it may be slightly delayed, it is more reliable. Once the bottom divergence appears, if the histogram changes color or shows a golden cross, investors can buy in.
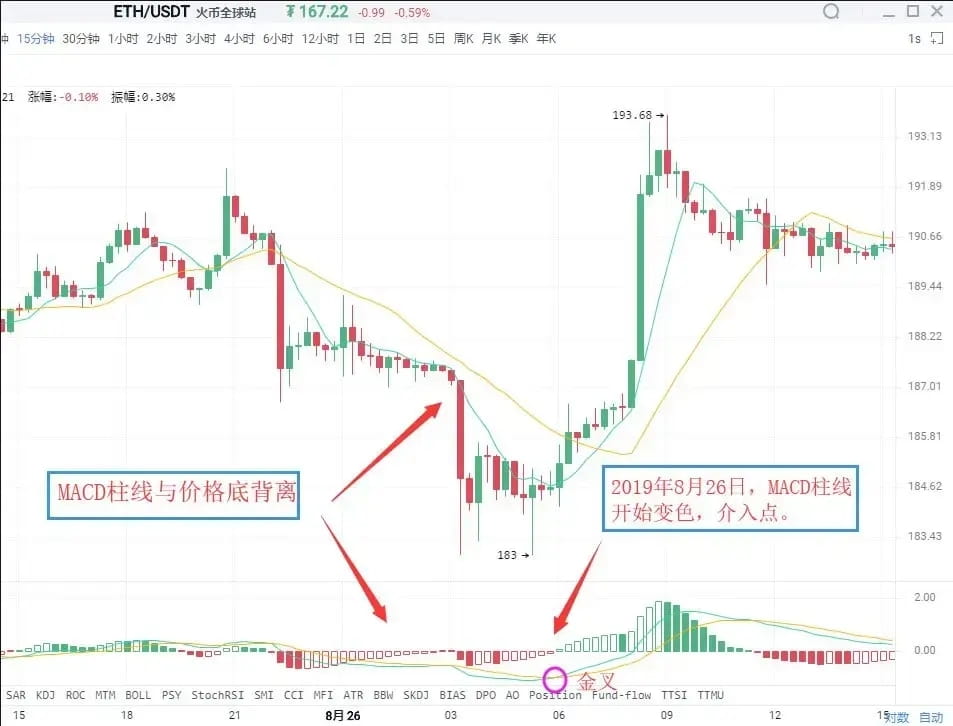
As shown in the image:
On August 26, 2019, in the Ethereum (ETH) 15-minute K-line chart, the price of Ethereum reached a new low during a downward trend, but the MACD histogram did not reach a new low, forming a bottom divergence between the histogram and the price. This indicates that upward momentum is beginning to accumulate, and the price is likely to rise soon.
Subsequently, the histogram changed color, and these two buy signals appearing in succession further increase the reliability of the upward movement, allowing investors to enter when the histogram changes color.
Second: Combine with other technical analysis tools and K-line reversal patterns.
Bottom divergence combined with K-line reversal patterns, such as 'single candle bottoming' and 'three soldiers at the bottom,' exemplifies the application of the 'multiple indicator combination' principle.
As shown in the image:
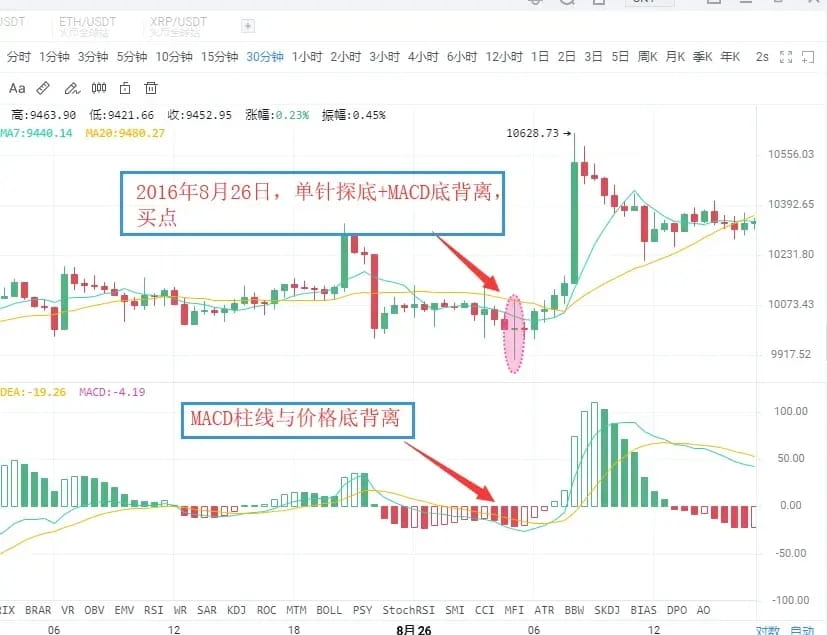
On August 26, 2016, in the BTC 30-minute K-line chart, the price of Bitcoin reached a new low, but the MACD histogram did not reach a new low, forming a bottom divergence between the histogram and the price, indicating that the upward momentum in the market is continuously strengthening.
Accompanied by the price's downward stop and rebound, this formed a buy signal of 'MACD histogram and price bottom divergence + K-line single candle bottoming.' Subsequently, the price experienced a wave of upward movement.
Ⅱ. Top Divergence
(1) Top divergence between the MACD histogram and the DIFF line.
The top divergence between the MACD histogram and the K-line occurs when the price reaches a new high in an upward trend, but the MACD histogram does not reach a new high. It indicates that downward momentum is accumulating in the market, and the price may drop at any time.
The divergence between the DIFF line and the K-line occurs when the price reaches a new high during an upward trend, but the DIFF line does not reach a new high. It indicates that downward momentum is continuously accumulating in the market, and there is a high probability that a downward movement will occur soon.
(2) Specific Selling Timing
Similar to bottom divergence, in practice, investors can use several methods in conjunction with multiple indicators to make sell signals more specific.
First: Histogram color change or MACD dead cross.
Once the MACD histogram and K-line form a top divergence, if the histogram suddenly shortens significantly, this indicates that downward momentum is starting to release. Investors should pay attention to sell in a timely manner. A change in the MACD histogram color indicates that downward momentum has gained an advantage, generally appearing after the histogram has been continuously shortening. If a top divergence occurs between the histogram and K-line, followed by a color change or a dead cross in the MACD, investors should be alert to exit in a timely manner.
As shown in the image:
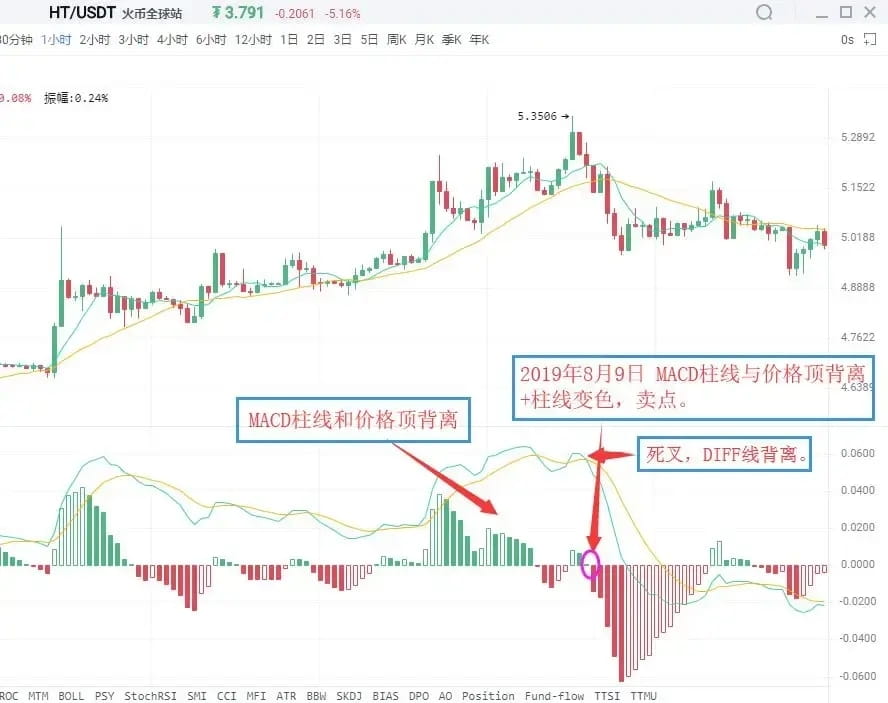
On August 9, 2019, in the HT 1-hour K-line chart, the Huobi price reached a new high, but the MACD histogram did not reach a new high, forming a divergence between the histogram and the price. This indicates that the market's downward momentum is beginning to accumulate, and the price may experience a downward trend at any time.
Subsequently, the MACD histogram changed from red to green, issuing a sell signal of 'histogram and price divergence + histogram color change.' Investors should pay attention and exit in a timely manner.
Second: Combine with other technical analysis tools and K-line reversal patterns.
When the MACD histogram diverges from the price, if other technical analysis tools also issue sell signals at the same time, the reliability of the market sell signal will greatly increase. At this point, investors should pay attention to exiting decisively. Common sell signals in this category include 'histogram and price divergence + K-line reversal pattern.'
As shown in the image:
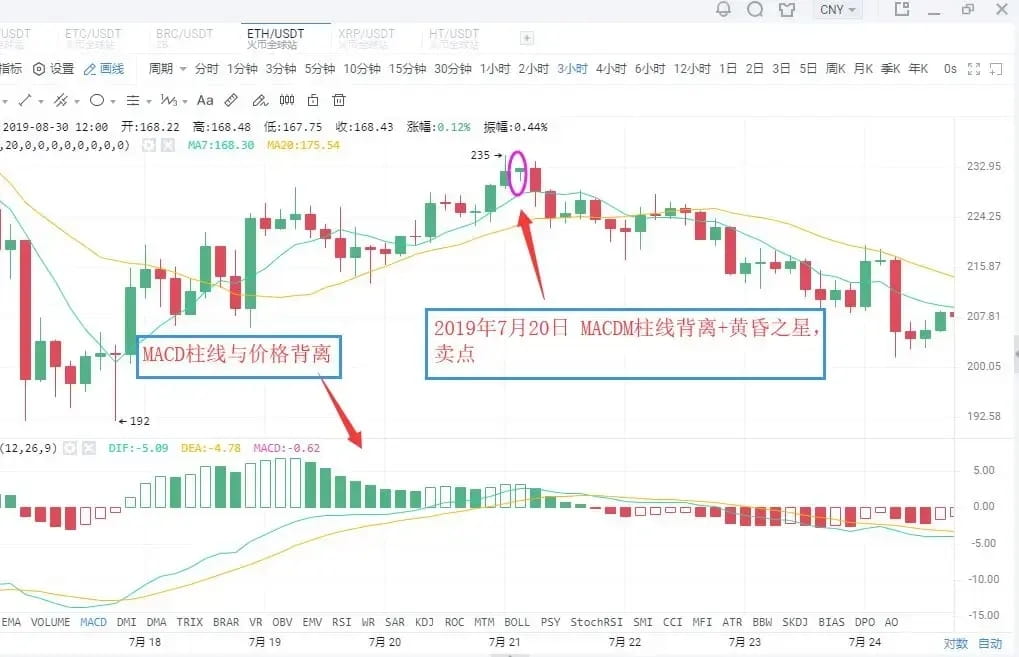
On July 20, 2019, in the ETH 3-hour K-line chart, the price of Ethereum reached a new high, but the MACD histogram did not reach a new high, forming a top divergence between the histogram and the price. This indicates that downward momentum is continuously strengthening, and the price may experience a wave of downward movement.
Subsequently, the MACD histogram gradually shortened, while the K-line formed a 'Evening Star' bearish pattern. Investors should pay attention to exit in a timely manner, as the K-line exhibited a significant downward trend afterward.
Appendix:
Evening Star: During an upward trend, a long bullish candle appears first, followed by a second candle with a smaller body (either bullish or bearish), which is metaphorically referred to as a star, this forms the main part of the candlestick pattern. The third candle is a long bearish candle that deeply enters the body of the first candle. The Evening Star signals a top reversal, and some predict an accuracy rate of over 80%.
(Regarding some candlestick patterns for tops and bottoms, we will have several dedicated courses for in-depth explanations, so stay tuned.)
Modification of MACD Parameters
The lag in response to price changes sometimes results in less than ideal buy and sell levels, which is a flaw of the MACD indicator. One way to change this situation is to adjust the indicator parameters to make the MACD more sensitive to price movements, thus allowing for more favorable buy and sell levels.
In commonly used market analysis software, the default parameters for the MACD indicator are 12/26/9. Under this parameter setting, the MACD indicator often exhibits significant lag.
The lag of the MACD indicator can be addressed by parameter adjustments. Common parameter combinations include 5/34/5, 5/10/30, etc. Investors can experiment and explore in practice.
Execution is a critical flaw in trading; holding onto losing positions is a common ailment in investing. Without good execution, even the best strategies cannot be monetized. However, excessive holding amplifies even the smallest mistakes, like a disease that multiplies. When you can no longer hold on and leave the market, I estimate that no one will say goodbye to you; even if you've come, no one will remember you a year later. Any entry cannot rely on luck to hold; any betting cannot rely on going all-in. One misstep will lead to an exit; a hundred successes count as success.
Having summarized ten rules and insights for trading cryptocurrencies, the content is brief but highly valuable. If after reading you feel it lacks reason, you can say whatever you like!
1. Never chase high prices to buy coins; maintain a mindset where the coin can rise as much as it wants, treating it as if it doesn't exist.
2. There are only two types of coins: the coins at your buy points are good coins, otherwise, they are trash; coins at higher-level buy points are the best-performing coins. Patiently wait for the high-level coins to become genuine high-quality stocks; that is the true mindset.
3. In fact, the most important factor in trading cryptocurrencies is mindset. Many people know very well that it's not a buy point, yet they can't resist the urge to act; this is a mindset issue. If this isn't resolved, any theory is useless.
4. Your mindset should be stable; do not have feelings for any coin or price point, only look at market signals. You should have feelings for buy and sell points. If your skills are good and your capital is large, for example, if you're operating on a 30-minute basis, then timing doesn't matter.
5. The reasons for errors are never related to the market. When looking for reasons, you can only find them within yourself. Every misstep must be summarized immediately.
6. The mindset of urgently wanting to make money is a major taboo for participants in cryptocurrency trading. If you cannot control your own heart and cannot manage your greed and desires, you cannot succeed in the market for long.
7. Trading cryptocurrencies tests long-term profitability, not ability for a one-time explosion; the key is a long-term effective trading strategy. When buying, consider all scenarios, be decisive in holding, and even more decisive in selling to gradually improve. You trade the coins, not the other way around; start by working on yourself.
8. The virtual currency market rewards only those with patience; any good coin needs to be nurtured. Constantly switching new coins will surely result in small capital and minor profits. Focus more; jumping around daily will definitely not yield big profits.
9. Dance to the rhythm of the market; as long as you follow the market's rhythm, you can navigate through it effortlessly. Rhythm is always the market's rhythm. A market participant without a sense of rhythm will always endure torment. Cast aside your greed and fear, and listen to the market's rhythm. As long as you can act according to the rhythm, no one can stop you. The market has its rhythm; grasp the current rhythm, and no one can defeat you.
10. Those who play with capital must remember that the power of compound interest is the greatest. As long as you have a good mindset and skills, compound interest is inevitable, and this can conquer all.
Playing in the crypto space is essentially a battle between retail investors and institutional investors. If you lack insider information and first-hand data, you will be cut off! If you wish to collaborate on layouts and harvest from institutional investors, you can follow Brother Liang. Like-minded crypto enthusiasts are welcome to discuss together!
The secrets of success have been shared with you; whether you can become famous in the market depends on your own efforts.#美国加征关税 $BTC