In the ever-changing world of cryptocurrency, we have been seeking more accurate market signals. Today, we introduce a brand new indicator aimed at measuring Bitcoin's price momentum potential over a specific time period, with the time level currently set to 30 days.
This indicator effectively balances the fluctuations of market prices within a 30-day time window through a unique calculation method involving differentiation and median factor multiplication. This innovative design allows us to more keenly capture mid-term market signals while tracking price trends, skillfully avoiding the interference of short-term price turbulence, and providing more valuable references for investment decisions.
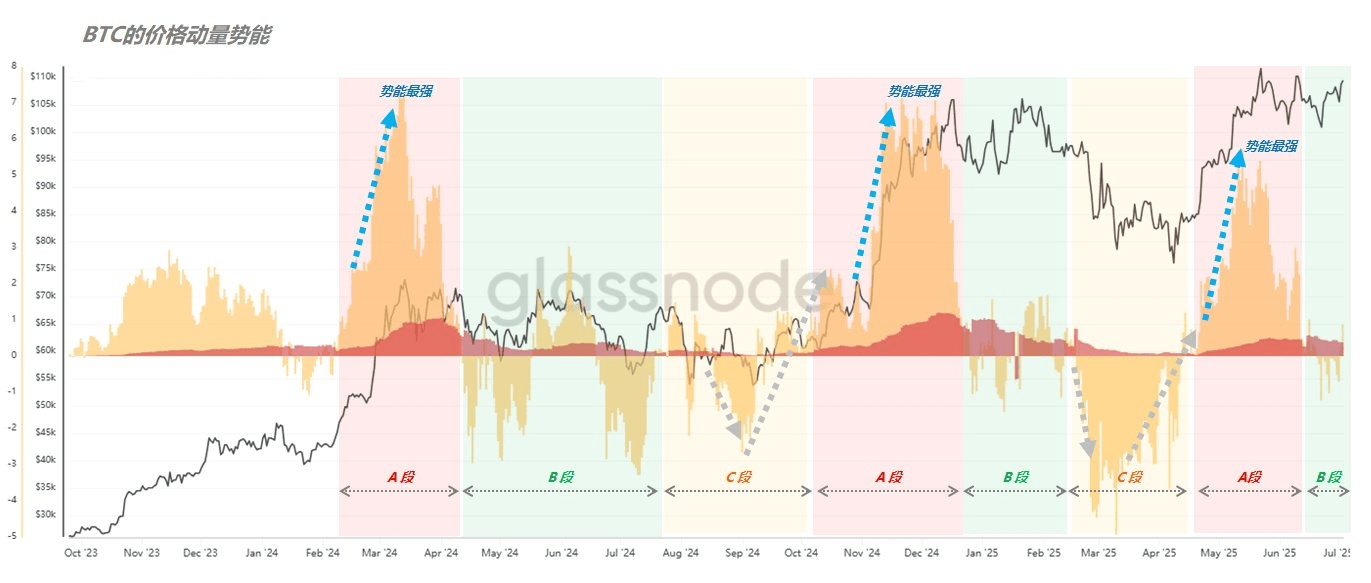
(Figure 1)
From the trends presented by the indicator, Bitcoin has experienced three critical breakthroughs of historical highs since March 2024, each accompanied by clear three-phase momentum changes, which we have labeled as segments A, B, and C.
In segment A, Bitcoin demonstrates unparalleled strength, with its price momentum potential reaching a peak, corresponding to Bitcoin's absolute dominance in the market's price trend, presenting a prosperous market scene.
Subsequently, the indicator retreated from its high and entered segment B. At this time, the price momentum potential oscillates around the zero axis, and the market enters a painfully grinding phase. In the absence of major event-driven factors, Bitcoin's price remains in a wide-ranging consolidation for most of the time. This consolidation causes severe divergence in market sentiment, with players having differing views on Bitcoin's future direction, leading to intense competition between bulls and bears.
When the market encounters significant negative events, panic spreads rapidly, and a large amount of selling leads to a panic clearing of the market. At this point, we can observe that the momentum potential indicator begins to slowly rise from the bottom, marking the market's entry into segment C. Segment C is the last window period before a market trend shift and contains new investment opportunities.
From the timeline analysis of the current indicator, we are in the market environment of segment B and have not yet reached the turning point of segment C. Of course, the market is full of uncertainty; if there are no significant negative events, the market may continue to operate in segment B until the next strong upward trend of segment A begins.
Although this brand-new indicator has shown significant effectiveness in historical backtesting, future market changes are difficult to predict. Whether it can continue to provide us with effective market signals accurately still requires further testing over time. We hope this indicator can provide friends with a new perspective, offering more reference and grasp in the complex and ever-changing cryptocurrency market.