I am currently still shorting; yesterday I basically entered a short position at the highest point of the altcoin 4-hour to daily level.
I am not blindly bearish; my followers know that I have been bullish and taking long positions from May to June.
This post briefly explains when I will be bullish again.
My personal trading logic for trend reversal is not complicated—naked K Dow's 123.
Many people should know about the Dow's 123 pattern, but the same trading technique may be used differently by different traders based on their habits. Personally, I tend to do trend-following medium-term trading, so I mainly use it to judge trend reversals and formations.
The first image below is the candlestick chart of the altcoin $OTHERS at the daily level. The blue line is the 123 annotation points of the 4-hour to daily level; I personally like to add a 0 to the lowest point. The yellow line represents the annotation points of the 0123 at a larger cycle of the weekly level.
The second image is the candlestick chart of the altcoin $OTHERS at the weekly level.
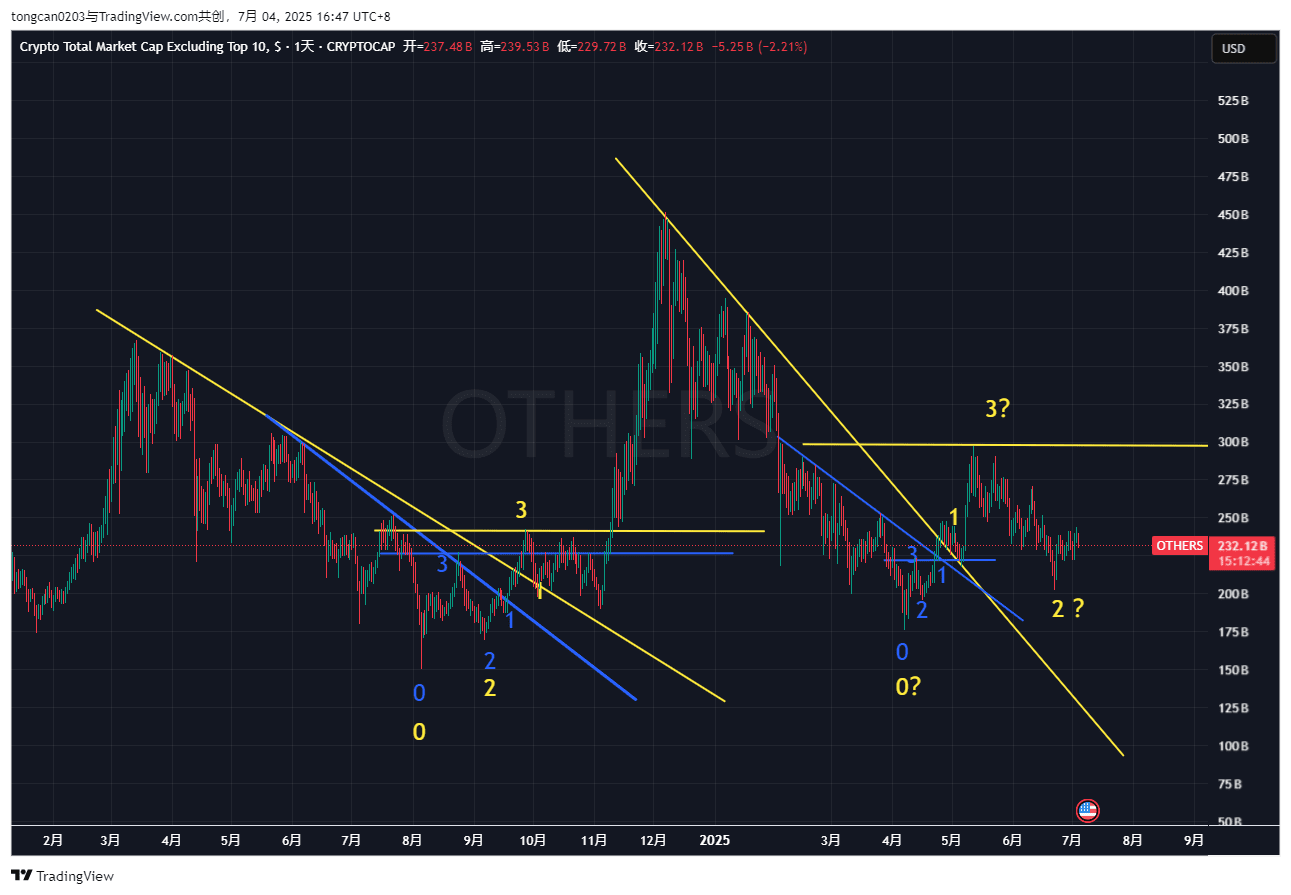
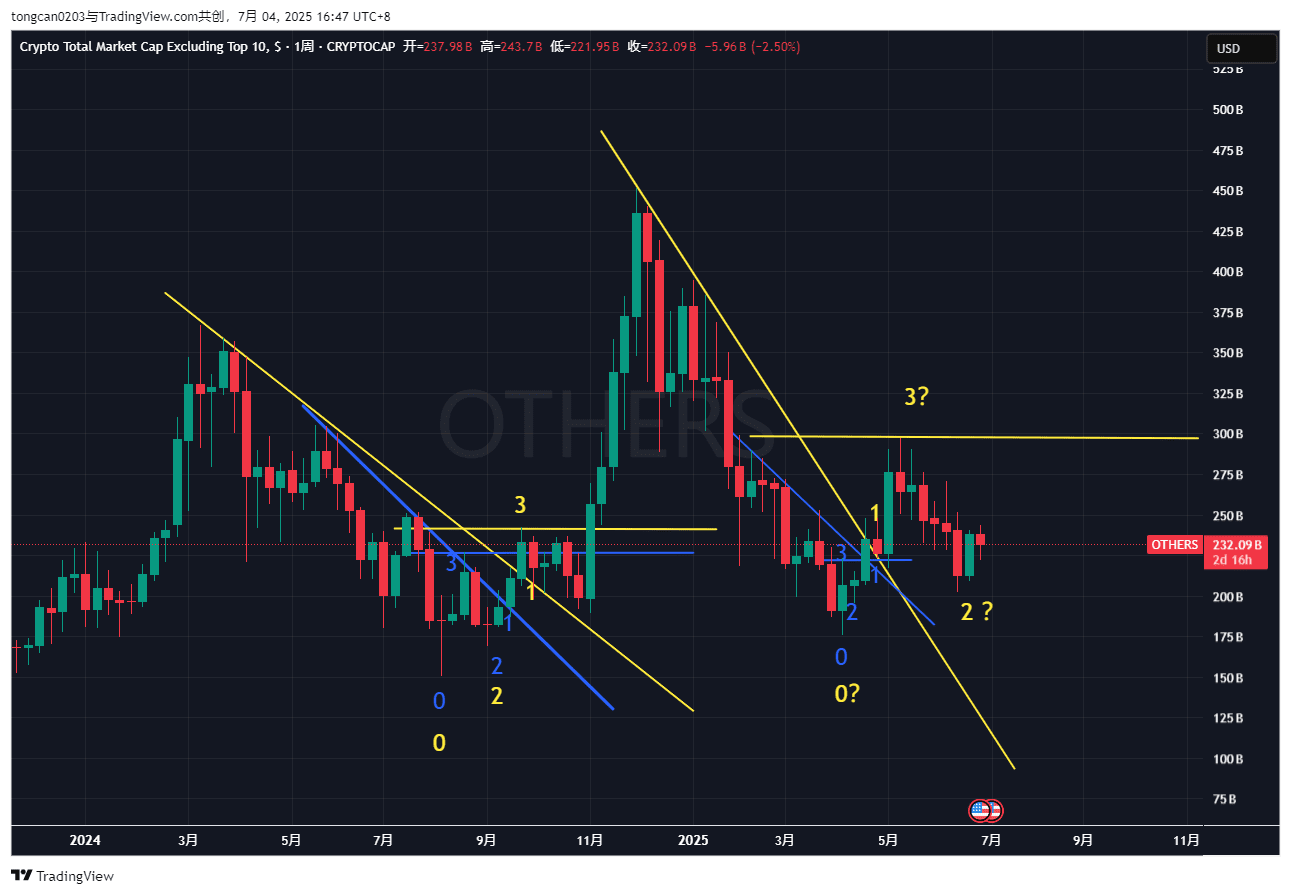
The reason for separating into blue line (4-hour to daily level) and yellow line (weekly level) is that although they are the same trend lines and annotated points, I specifically provided two daily and weekly charts for everyone.
This is because I have an experience in practical trading and application: the effective reversal of the 123 trend often starts from the formation at the 4-hour to daily level, then spreads to the weekly level.
For example, from August to early November 2024, the 123 reversal at the blue line (4-hour to daily cycle) first appears, then the yellow weekly level's 0 and 2 confirm overlap with the daily level's 0 and 2, while 1 and 3 respectively rise, subsequently effectively spreading to the weekly level's 123, officially forming a bullish trend.
The recent trend looks very similar to last year's August to November, where a 123 pattern appeared in April to May (blue line, 4-hour to daily level). However, currently, the yellow weekly level 2 can first be confirmed as not overlapping with the blue daily level 2. Additionally, we cannot yet confirm if the yellow 2, which is the low point of June 22, is the position of the higher low at the weekly level.
If the market shakes and falls again, and the altcoin trend breaks below the current position of 2?, it will mean that the position of 2? is invalidated. The market will need to continue to consolidate and wait for the appearance of a higher low. If it directly breaks below the previous blue 0 position, it will take a longer time to form an overall trend reversal.
Therefore, my personal timing for being bullish again is to first wait for the effective formation of the yellow 2 at the weekly level. When the daily level candlestick starts to attempt to break through the position of yellow 3 again, I will consider entering a long position, confirming that the daily level retracement does not break yellow 3, and then start to go fully long.
The above is for everyone's reference.
