1. Market Logic and Mindset Building
The essence of 'enjoying rather than resisting' amidst the volatility in the crypto space is to learn to recognize the tactics of major players manipulating the market — the previous panic created by Ethereum followed by a rebound is a typical example of a 'false breakdown to induce shorts'. Instead of wallowing in self-pity after losing money, it's better to summarize the patterns: only those who can identify false breakdowns can survive on the battlefield.
2. Key Signal Analysis in Technical Aspects
🔹 Teaching on False Breakdown Cases
• Case Analysis: At the white arrow, the bearish line's lowest was $2187, but the hourly closing price was $2219, which closed above $2200, belonging to a typical false breakdown (the key is to look at the entity closing price rather than the lower shadow line);
• Core Principle: The validity of support/resistance levels is based on the 'entity closing price'; shadow line breakthroughs are meaningless.
🔹 EMA Moving Average and MACD Risks
• Daily EMA50 Moving Average: current key resistance level, stabilizing here may lead to a rally, losing it may test previous lows again;
• MACD Warning: Both fast and slow lines are below the zero axis, indicating a bear dominance; the risk of decline is not eliminated until recovering the zero axis.
3. Key Levels and Trading Strategies
🔹 Right-Side Trading Signals
• Long Conditions:
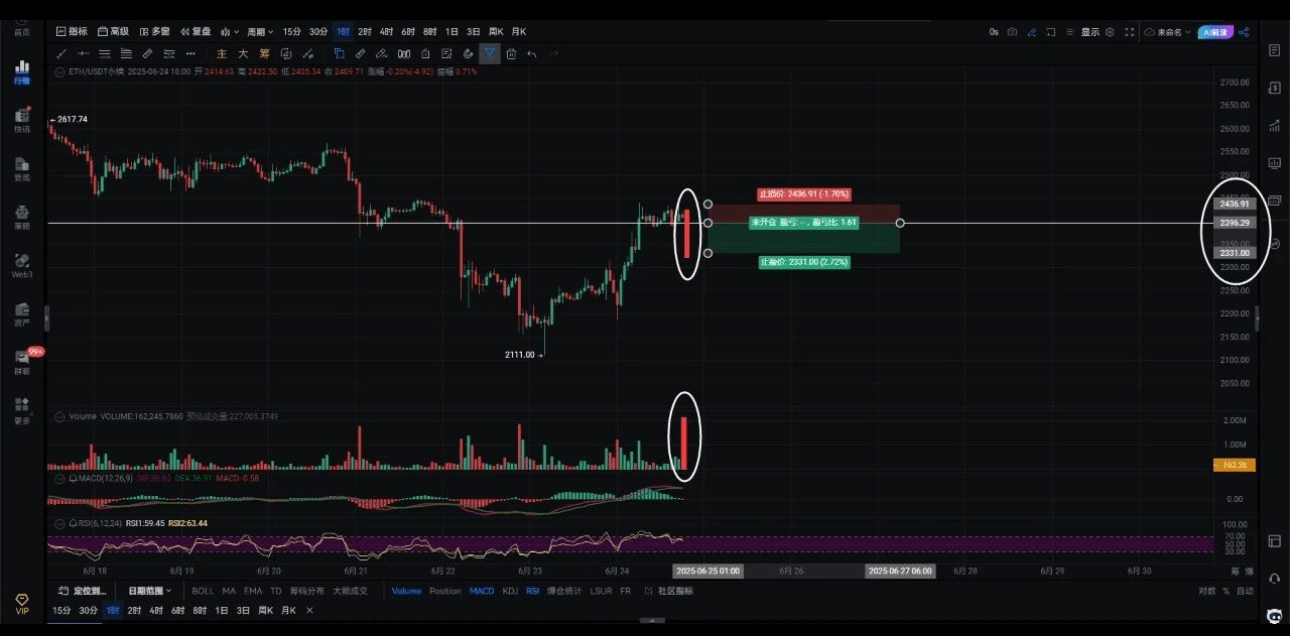
1. Volume breakout at $2422 → chase long on the right side, target $2484 → $2508, stop loss on breakdown;
• Shorting Conditions:
1. Volume breakdown below $2396 → chase short on the right side, target $2379 → $2318, stop loss on recovery.
🔹 Multi-Cycle Target Levels
• Hourly Level: Break above $2432 → target $2484 → $2508;
• 4-Hour Level:
◦ Breakdown below $2379 → target down to $2318 → $2266;
◦ $2318 is the ultimate defense; losing it will weaken the trend.
4. Risk Control and Operation Reminders
1. Core of False Breakdown Identification:
◦ Support level judgment only looks at the closing price, a shadow line breakdown is a trap for shorts, a genuine breakdown is characterized by an entity breakdown;
2. EMA50 Moving Average Discipline:
◦ Before the daily line stabilizes above the EMA50 moving average, all long positions are seen as rebound gambles, take profit once in profit;
3. MACD Zero Axis Pressure:
◦ When the fast and slow lines are below the zero axis, the probability of encountering resistance during a rebound is high, hence one can short at highs;
4. Position Management:
◦ Breakout/breakdown trades require volume confirmation, light position for trial trades, and avoid the funding risk under the dual pressure of EMA moving averages and MACD.
5. Market Summary
Ethereum is currently under dual pressure from the EMA50 moving average and the MACD zero axis; the false breakdown case suggests vigilance against market manipulation. Core operation: stay long if above EMA50, short if below $2396, do not chase highs before recovering the MACD zero axis. Remember: in the crypto space, only those who understand the 'closing price code' can avoid traps and seize opportunities.