
Ripple's price ($XRP ) continued to decline on Monday, falling below the important support level of $2.
Ripple's price ($XRP ) has declined for five consecutive days, marking its longest losing streak in over a month, and is now trading at its lowest level since April 11. The price of the currency has dropped by more than 40% from its yearly high, and technical analysis suggests it may drop below the one-dollar level.
Ripple's price has declined due to three main factors. First, the SEC delayed its decision on the Franklin Templeton ETF $XRP .
The trader in the stock market last week, pointing to the need for further analysis.
On the positive side, some cryptocurrency traders still expect the agency to approve the #XRP ETF later this year. According to Bully Market, the odds of approval by the end of the year exceed 80%.
Secondly, Ripple's price was negatively impacted by the broader cryptocurrency market crash, following escalating geopolitical tensions in the Middle East. This crisis led to a correction in Bitcoin's price (#BTC ), pushing many altcoins into a market downturn.
Thirdly, XRP's record still faces challenges in the decentralized finance space. On-chain data shows that total value locked has dropped by more than 12.5% over the past thirty days to $54.2 million. The supply of stablecoins stands at $71 million, which is significantly lower than newer chains like So,nic and Berac,,hain.
Technical analysis of XRP's price indicates a potential collapse.
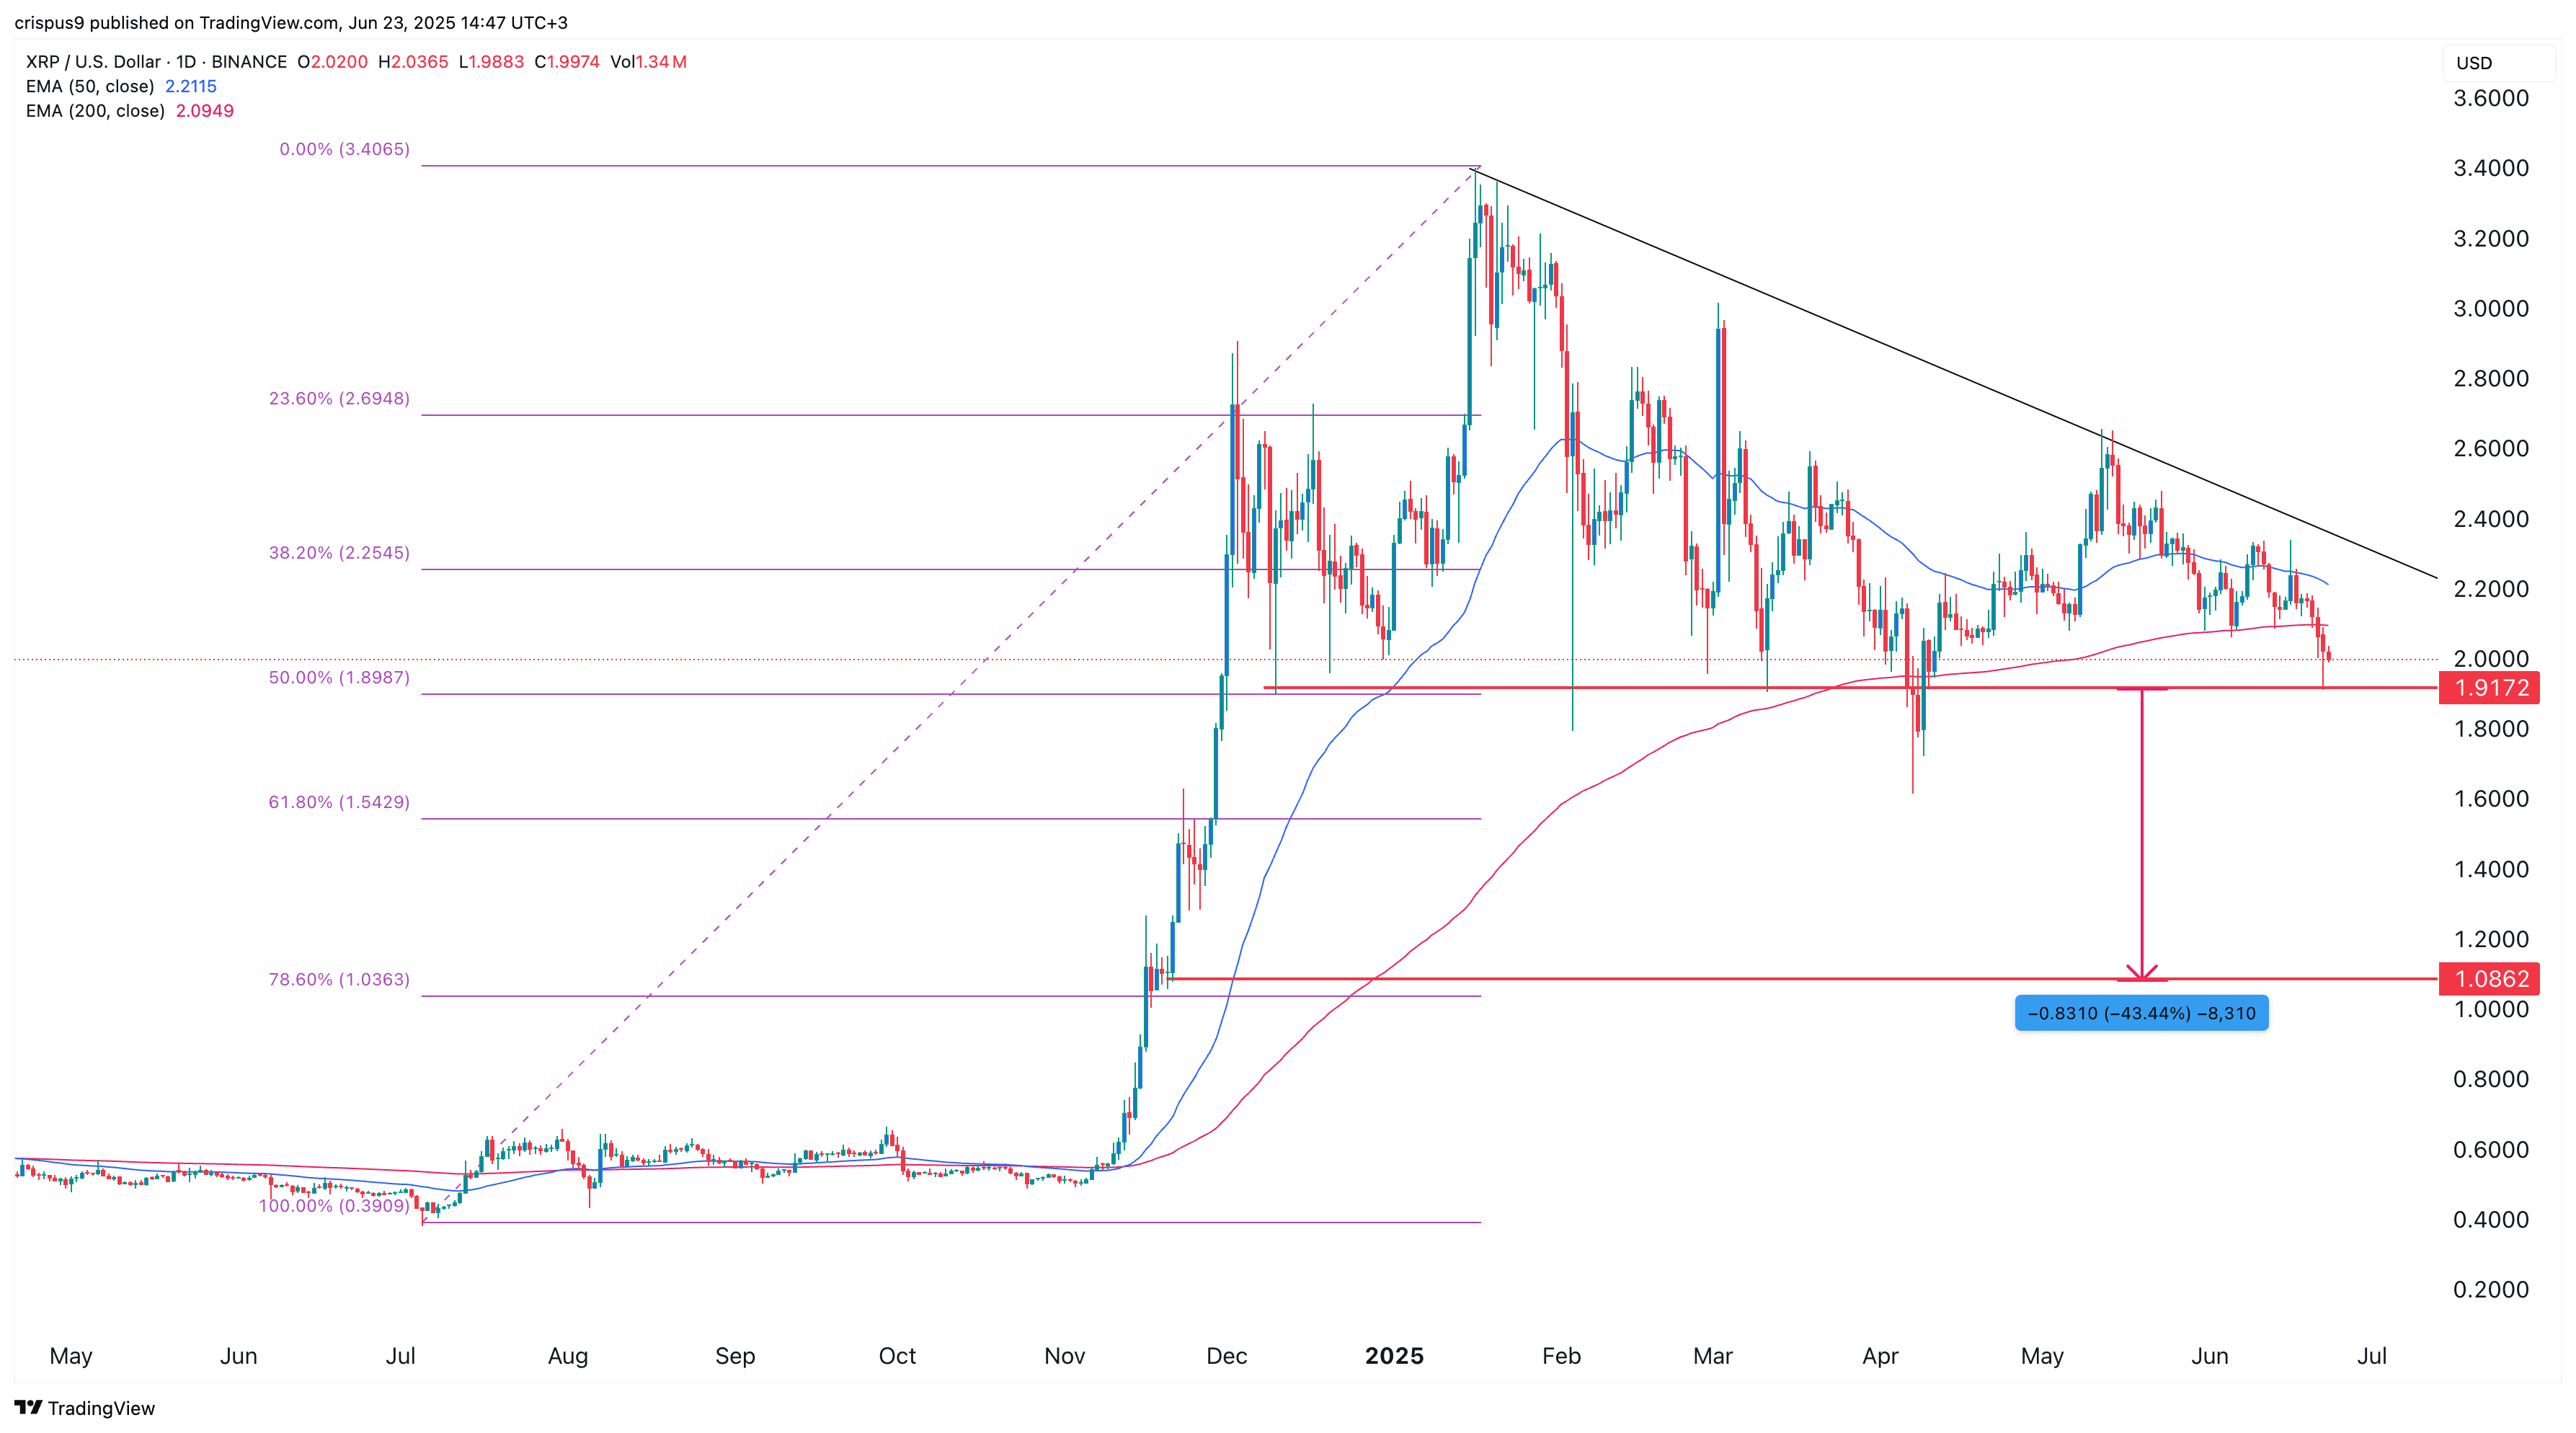
XRP price chart
The daily chart shows that Ripple (XRP) has experienced a continuous downward trend over the past few months, falling from $3.40 in January to around $2 today.
The currency has now reached a Fibonacci retracement level of 50% at $1.8990, representing a 45% drop from this year's peak. It has also fallen below the 50-day and 200-day exponential moving averages.
Notably, #الريبل has formed a descending triangle pattern, a traditional bearish continuation pattern. Historically, this pattern often leads to further declines once the lower support level is breached.
The target price for the descending triangle is calculated by measuring the height of the triangle at its widest point and projecting that distance downward from the breakout level.
In this case, the expected movement indicates a 43% drop from the base of the triangle, making the target close to $1.08. A drop in XRP's price below this level would increase the likelihood of it falling below the major psychological threshold of one dollar.
However, breaking the resistance level at $2.20 would invalidate the bearish expectations and indicate the potential for further gains.
You might also be interested in previous posts: What to expect next week for the altcoin market: Bitcoin, Bira, NJ, and others