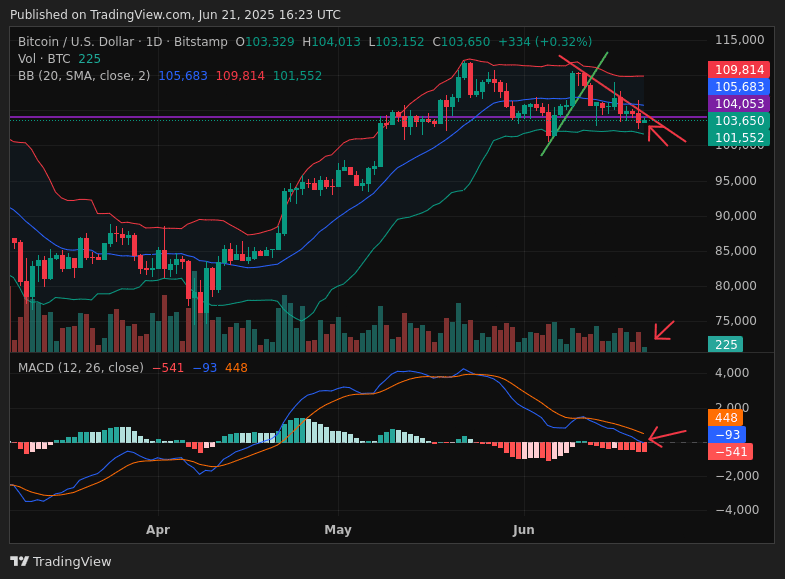
Pay close attention to the purple line and what has recently happened to the price in that area. If it was above it, it often served as support, and if it was below it, it served as resistance.
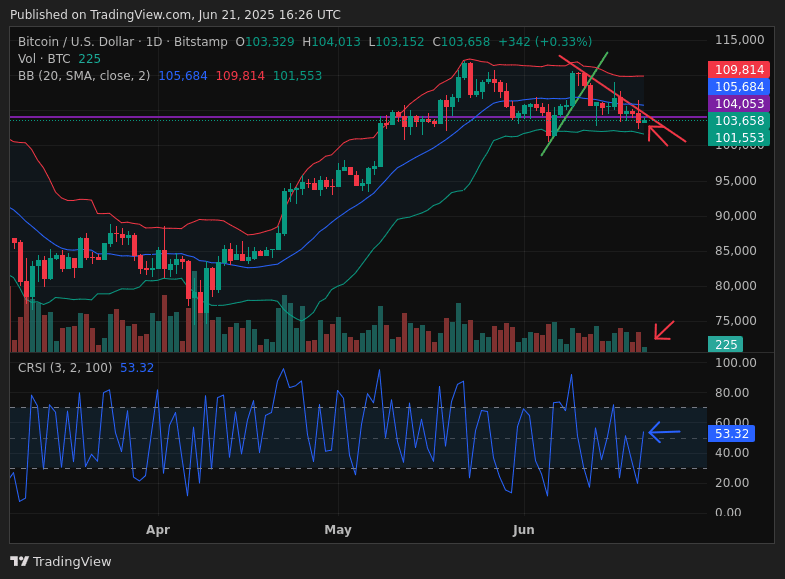
Currently, the price of Bitcoin is below that zone (104k), under a bearish diagonal (which it could not overcome), with less volume than the previous day, and the MACD moving average is entering a bearish zone (below the histogram) with a red bar despite today being a bullish candle (daily timeframe).
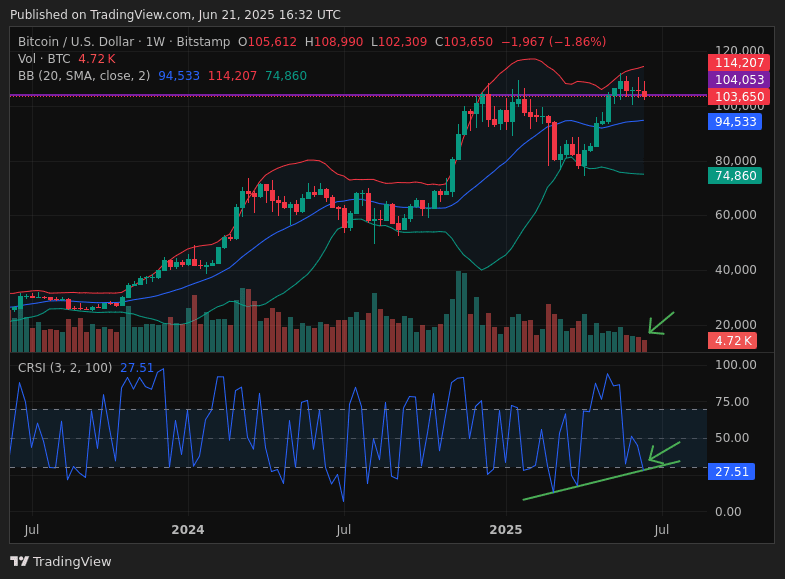
However, from a weekly perspective, there are positive signs: RSI slightly touching the oversold zone, right on the bullish diagonal, and decreasing volume within the downtrend.
Understanding all these signals, I could say that $BTC is at a potential decision point. On the one hand, the price is under bearish pressure, but on the other, it appears to be building strength. We'll see if it has what it takes to remain at the 104k support and rebound, or if it heads for a new destination via 94k.
