💡 Quick Technical Analysis:
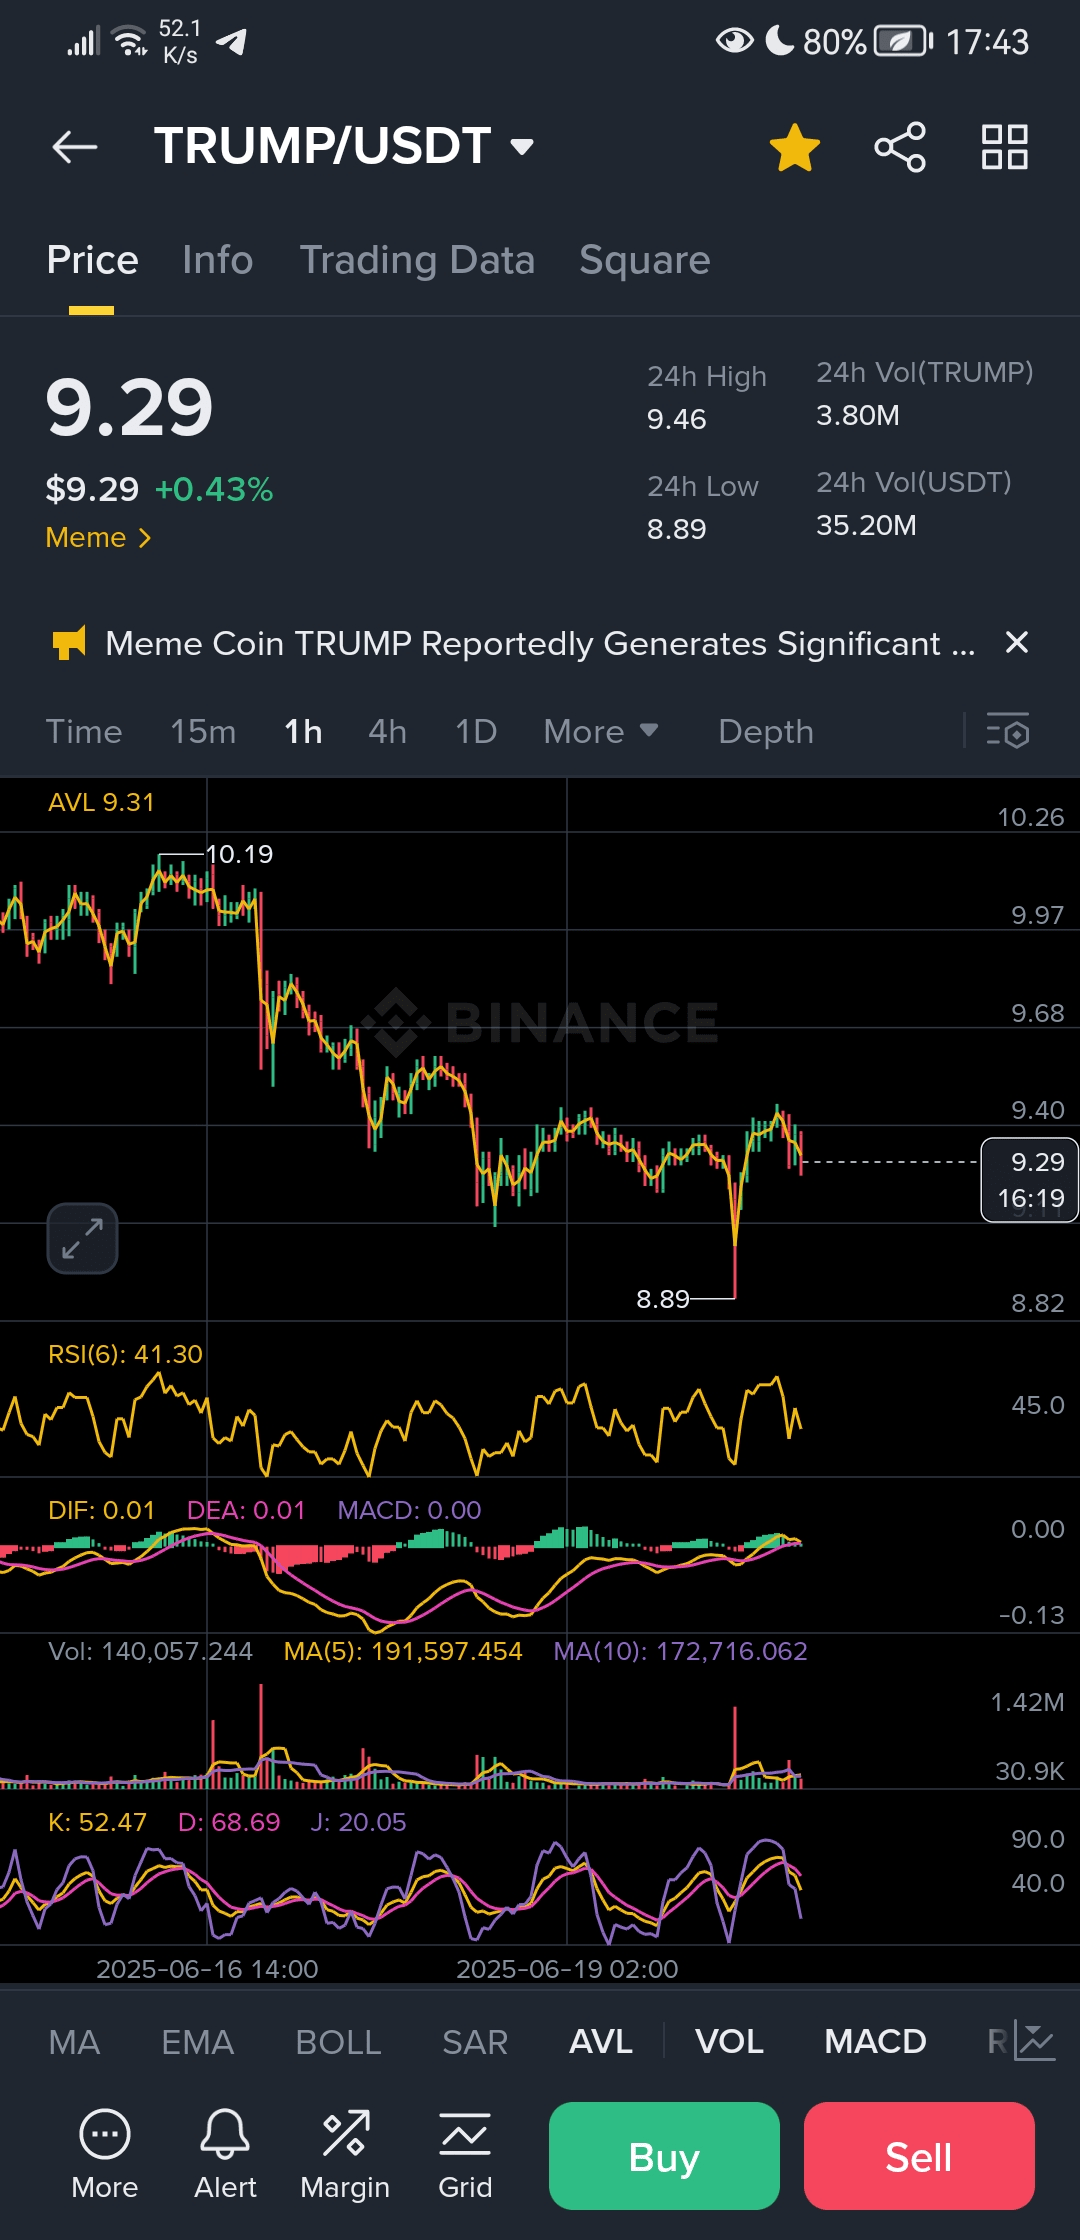
✅ Quick bounce from the bottom! After the sharp drop to 8.89, TRUMP rebounded strongly to rise above 9.29 again, indicating strong buying intervention at support.
✅ The Relative Strength Index (RSI) is at 41.30 – it has not entered the overbought zone yet, which means there is plenty of room for upward movement!
✅ MACD is about to cross positively! A clear convergence between the DIF and DEA lines, indicating potential bullish momentum in the coming hours.
$TRUMP
📊 Additional Indicators:
High trading volume (Vol): Liquidity is strongly present, and the volatility may open up golden opportunities!
The MA(5) and MA(10) averages are close to each other = the market is in a consolidation phase waiting for a spark to launch.
Stochastic Indicator (K at 52 and D at 68) shows the beginning of a gradual recovery in momentum.
🚀 Expected Scenario:
If TRUMP manages to break the resistance level of 9.40, the path may be paved for a return to 9.68 and possibly a retest of 10.00 again! However, in the case of a pullback, the level of 8.89 is a strong support not to be underestimated.
$TRUMP
🔥 Is TRUMP ready for the big bounce?! While the market fluctuates, signals are gathering in favor of buyers. Just one breakout could ignite a new upward wave – will you be among the early riders? 🚀🪙
📢 What do you think? Will it break $TRUMP the $10 level soon? Share your predictions 👇
