Throughout the day and into the evening, the market continues to oscillate and decline. The daily BOLL band middle track has mercilessly broken again, and our low long strategy has also regrettably hit the stop loss.
Currently, after the closing line in the early hours, Bitcoin has dropped sharply due to this wave of volume, and the TD indicator has again shown green TD1. Affected by the decline, the MA5 and 10-day moving averages have again resonated downward, and MACD and KDJ have turned from bullish to bearish. The weekly K has also shown a continuous upper shadow line pattern. From the current trend, if the daily line continues to show a volume decline tomorrow, the coin price will again test the support line of last week's low at 100500, which is also the support of the weekly MA10 moving average. If this position holds, there will be a chance for a rebound this week; otherwise, if it falls below the strong support at 100500, it is only a matter of time before Bitcoin returns to the 95000 line.
In terms of 4-hour analysis, with the K column showing 4 consecutive declines, the BOLL band has also shown a slight downward opening, and MACD and KDJ are resonating with a downward trend. The continuous pressure from the MA 5, 10, and 30-day moving averages indicates that the bears currently hold the dominant position. Combining with the hourly line, the K line shows a unilateral oscillation and downward trend, and the TD indicator has reached TD13, coupled with severely oversold indicators. There is a gap of nearly 2000 between the coin price and the MA 5-day moving average, and it is expected that the trend will first decline and then rebound tonight. The key support reference for the lower low point that needs to be monitored in the early hours is: 102500-100500. If the lower support is not broken, short-term can be used to seek low long strategies, with high point resistance reference at 105500-107200. Therefore, for operations from early morning to morning, my personal view is mainly high shorts, with low longs as a supplement.
Operation idea: 103000-102500 long Target: 105000-106000 Stop loss: 102000
High altitude point reference at line 105500-106500 Target: 102000
Ethereum's overall trend is currently synchronized with Bitcoin, plus the daily line overall trend is slower than Bitcoin by one cycle. The short-term market is also biased towards a oscillating downward trend. However, due to the volume and resilience not being as strong as Bitcoin, its high point resistance reference is at: 2550-2587. Low point support reference is at: 2430-2360 (do not chase highs and kill lows). Therefore, for operations from early morning to morning, my personal view is mainly high shorts, with low longs as a supplement.
Operation idea: 2455-2425 long Target: 2500-2550
High altitude point reference at: 2550-2580 Target: 2450-2400
For the short-term trend, it is expected to be sufficient, and will continue further.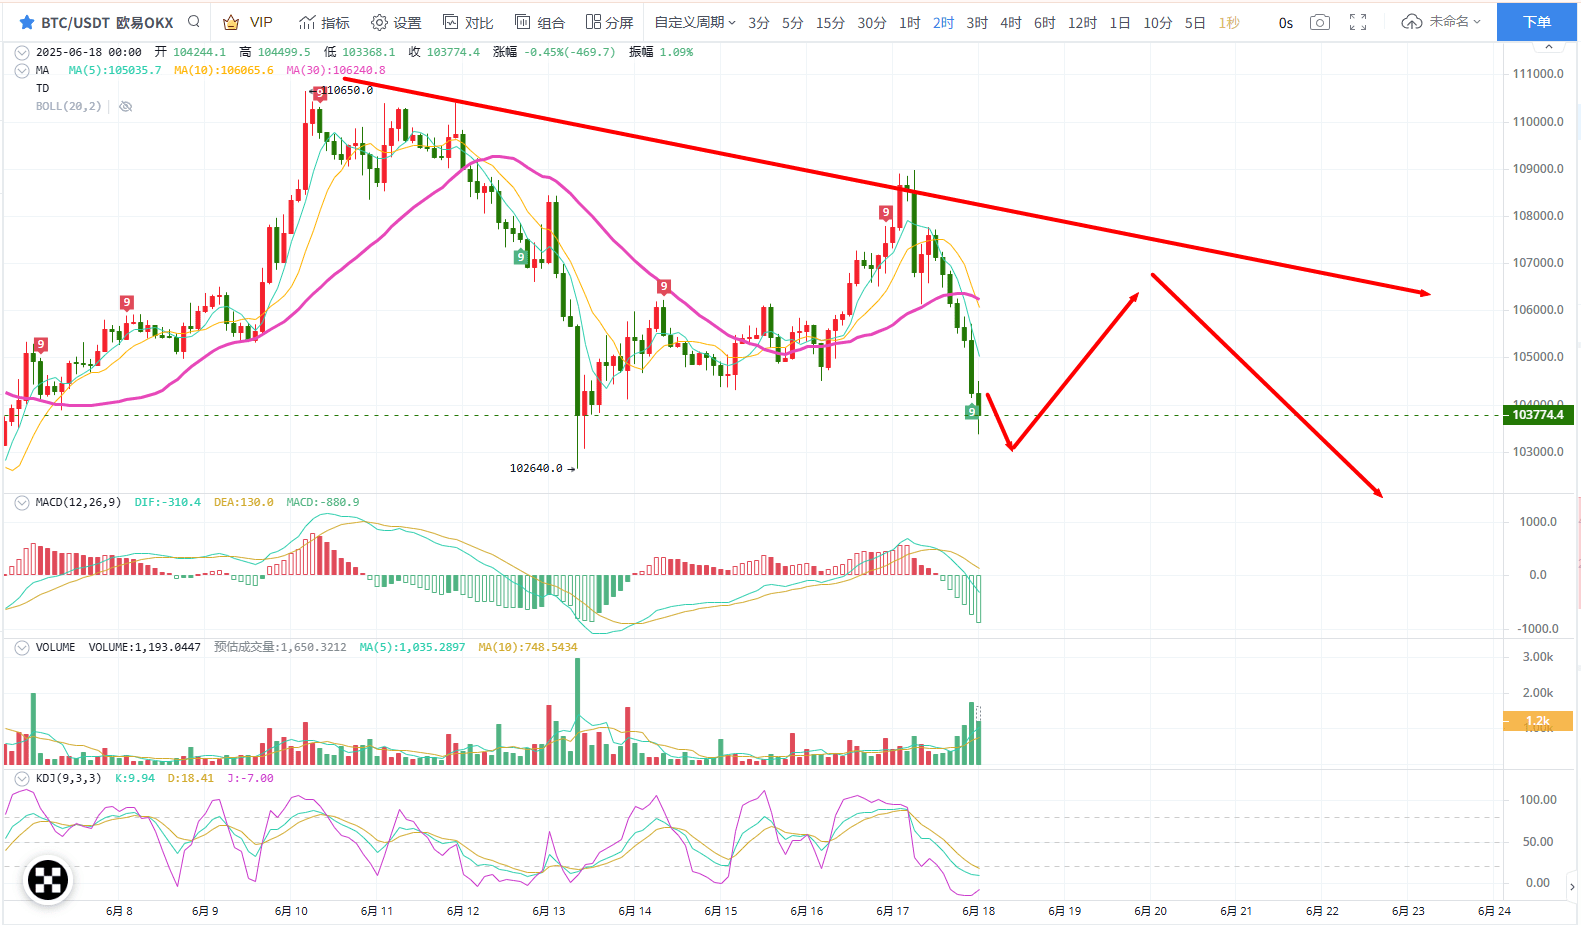 New#币安Alpha上新 #美联储FOMC会议 $ETH

