1. ETH Market Technical Analysis
[Daily Analysis]: Trend Structure: Since ETH broke through 1730 at the beginning of May, it has formed a main upward wave, peaking at 2879, and after recently retracing to 2450, there are clear signs of stabilization.
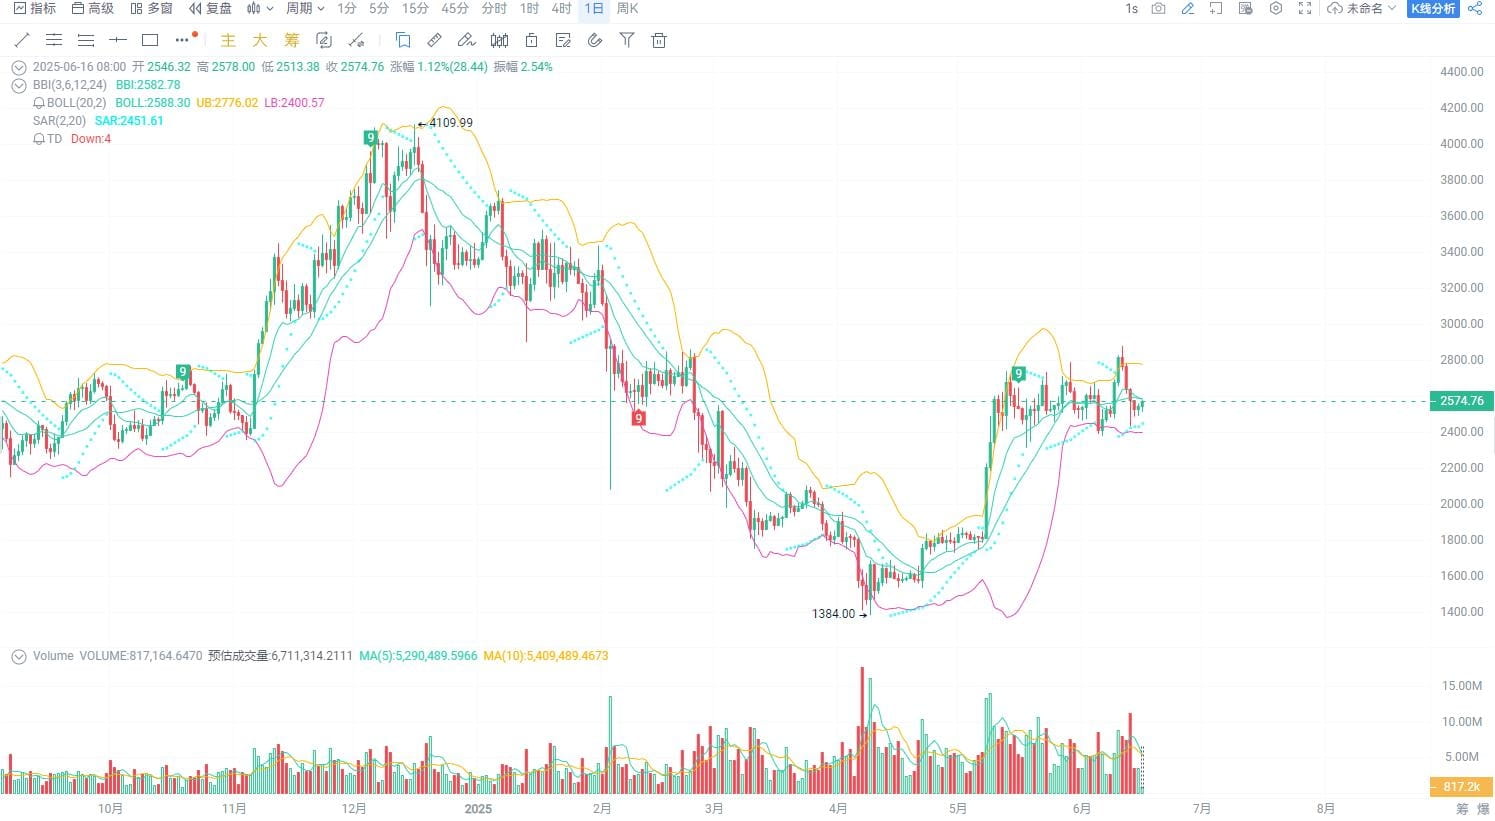
Moving Average Support: MA5 and MA10 are merging and flattening, showing signs of a reversal, forming a short-term bottom structure.
Bollinger Bands: The middle band has effectively retraced, and the current price is attempting to break through the upper band resistance, looking at short-term targets.
[4-Hour Analysis]: Bottom Formation Completed: A typical 'double bottom' structure has formed, with the low point around 2450, and the current price has broken through the neck line at 2535.
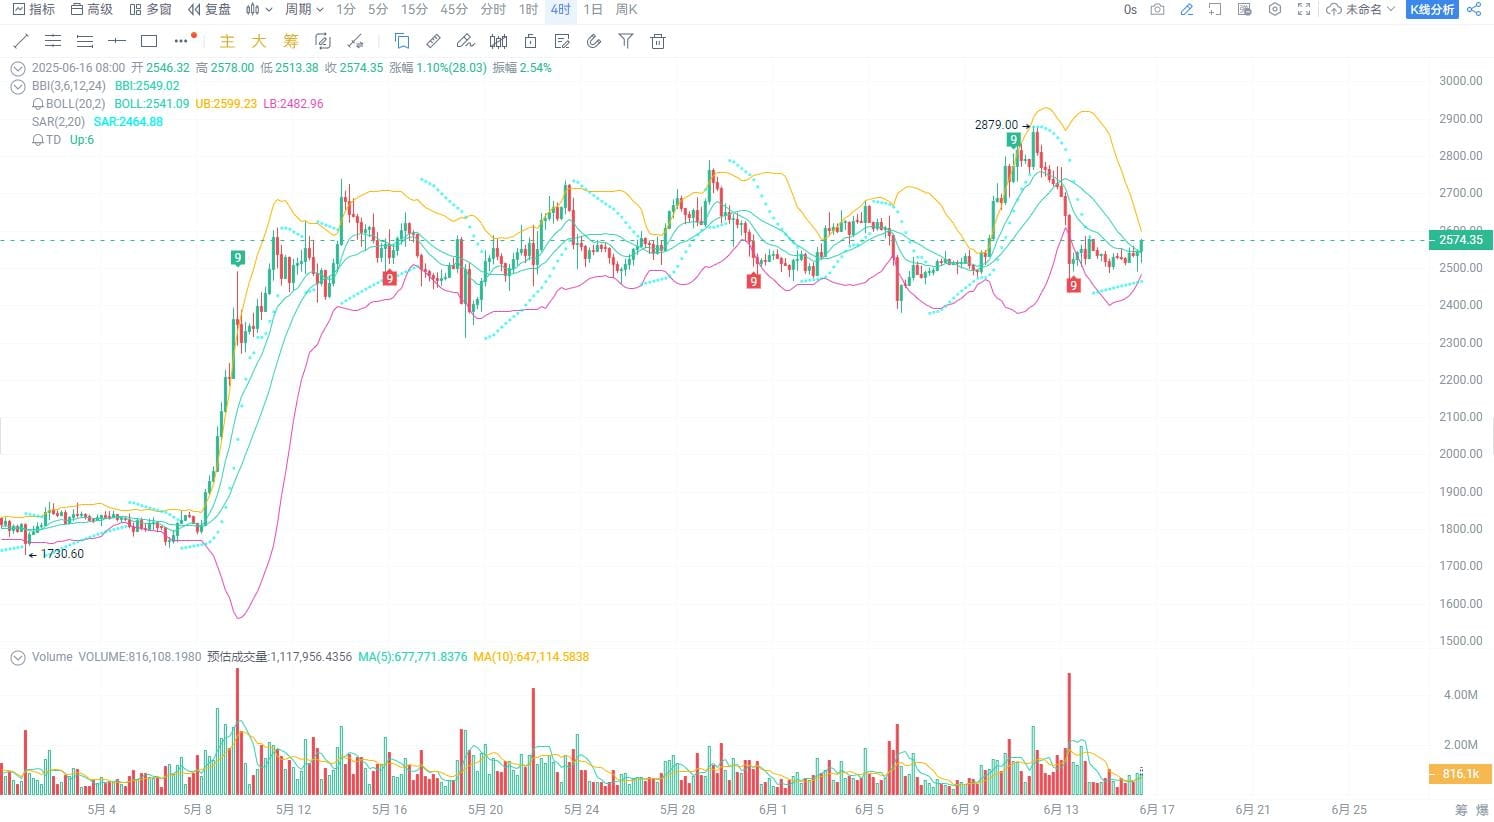
Volume Increase: The most recent bullish candlestick has broken through the upper boundary of the range with high volume, indicating that the market is entering a bullish acceleration phase.
BBI Bullish Arrangement: Multi-period moving averages are converging and moving upwards, with a strong short-term bullish trend.
[1-Hour Analysis]: Short-term Breakthrough of the Range: A breakout from the 2520-2560 oscillation range confirms bullish intentions.
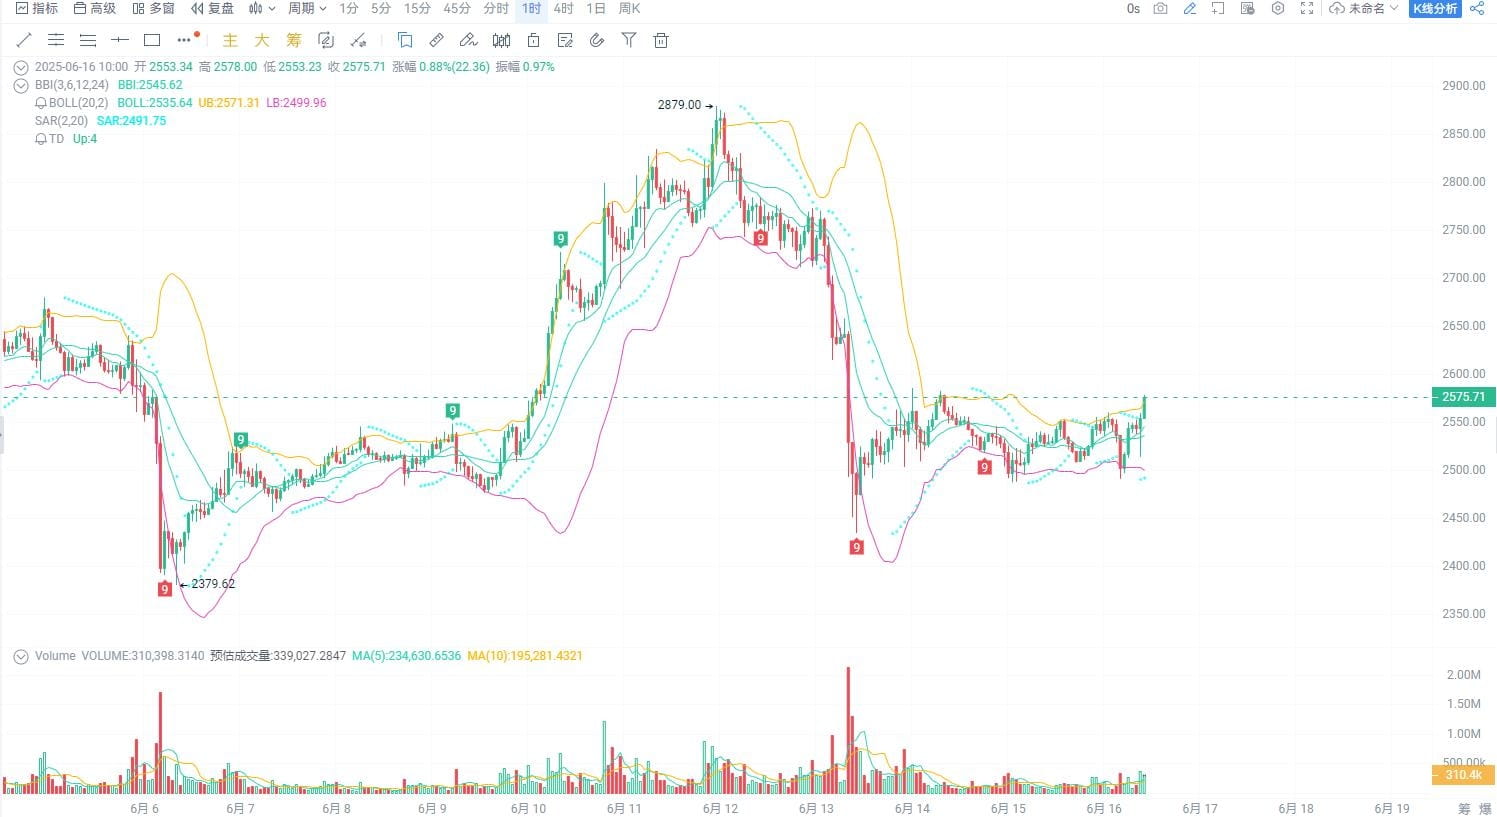
MACD Golden Cross (chart not displayed but inferred based on volume and price patterns): The momentum bars are starting to expand, indicating strong short-term momentum.
Entry Point 2572
First Take Profit Level 2600.58
Second Take Profit Level 2636.30
Stop Loss Level 2519.56
Trading Suggestions: Enter on Breakthrough: Directly build a long position at the current price of 2572, aggressive traders may use high leverage;
Take Profit in Batches: The first take profit is set at 2600 with a 50% reduction, the second take profit is at 2636 with a full exit;
Strict Stop Loss: If it falls below 2519, immediately exit to avoid further drawdown;
Position Suggestion: Control 8-10% of total capital with 125x leverage, heavy positions are risky.#DOGE #PEPE #sui #sol #TRUMP $ETH $DOGE $TRUMP


