Shi Ye discusses hot topics:
Yesterday I went out for a joyride; I had too much fun outdoors and simply gave up on updating the market. As a result, when I opened my eyes today, Bitcoin directly plunged by 7%. The reason isn’t complicated; the winds picked up in the Middle East, directly messing with market sentiment.
Investors are beginning to reassess risks; safety margins and inflation paths are all being recalculated. As a result, beautiful stocks fell together, and Bitcoin also dropped, while gold and oil rose sharply, with gold increasing by 4% in one go.
Who has been saying for a long time that Bitcoin is supposedly the digital gold? Why is it that when gold and oil are rising, you are the first to go down? Furthermore, there’s no need to delve deeply into Israel and Iran here; after all, I'm not a military channel blogger.
So let’s return to the market; speaking of which, do you think Bitcoin is falling like this because the bears are showing their power? No, the actual situation is that the spot market has not given the contract market any face. During these past two days of high volatility, watching the short liquidity in the contract market pile up frighteningly, it seems like it could explode at any moment.
But if the spot market is being heavily sold, no one can save it. If you can't understand this, don’t claim to understand contracts. Many people only see liquidity and don't see what’s behind the price.
This wave at the 110K position should have risen, but it didn't go up; there were likely already some insider traders taking the opportunity to sell off. In a market with information asymmetry, if you don't know about geopolitical crises in advance, others do, and they have already sold their chips cleanly while still seeing people shouting for a V-shaped reversal.
Now the bulls that should have cleared have mostly cleared, and the contract market has entered a new state of imbalance. The short leverage is piled too high, the funding rate has turned green, and the open interest is also decreasing.
What’s even more frustrating is that the spot premium index is about to break a new high; prices are falling while spot premiums are rising, leading to a significant data divergence. If you say short, the data doesn't support it; if you say long, the trend has broken.
So the most reasonable strategy in the current situation is one word: wait. If the US stock market opens tonight and the spot market also starts to back down and follows with a sell-off, causing the premium to drop, then once there is a rebound, you can short. If the spot market doesn't cooperate and keeps rising, then don't short, just watch.
The bulls can rely on only two points: one is that the contract open interest is at a new low, indicating that the bull liquidity has mostly been cleared. The other is the very obvious divergence in spot premiums; if geopolitical tensions ease, just relying on the bears to cover their positions could push for a rebound, at which point you should run if you can.
And what about the bears? If you still have short positions around 90K, don't say it, this wave has stabilized halfway; as long as the price makes a lower low, anything below 98K is possible.
Shi Ye observes the trend:
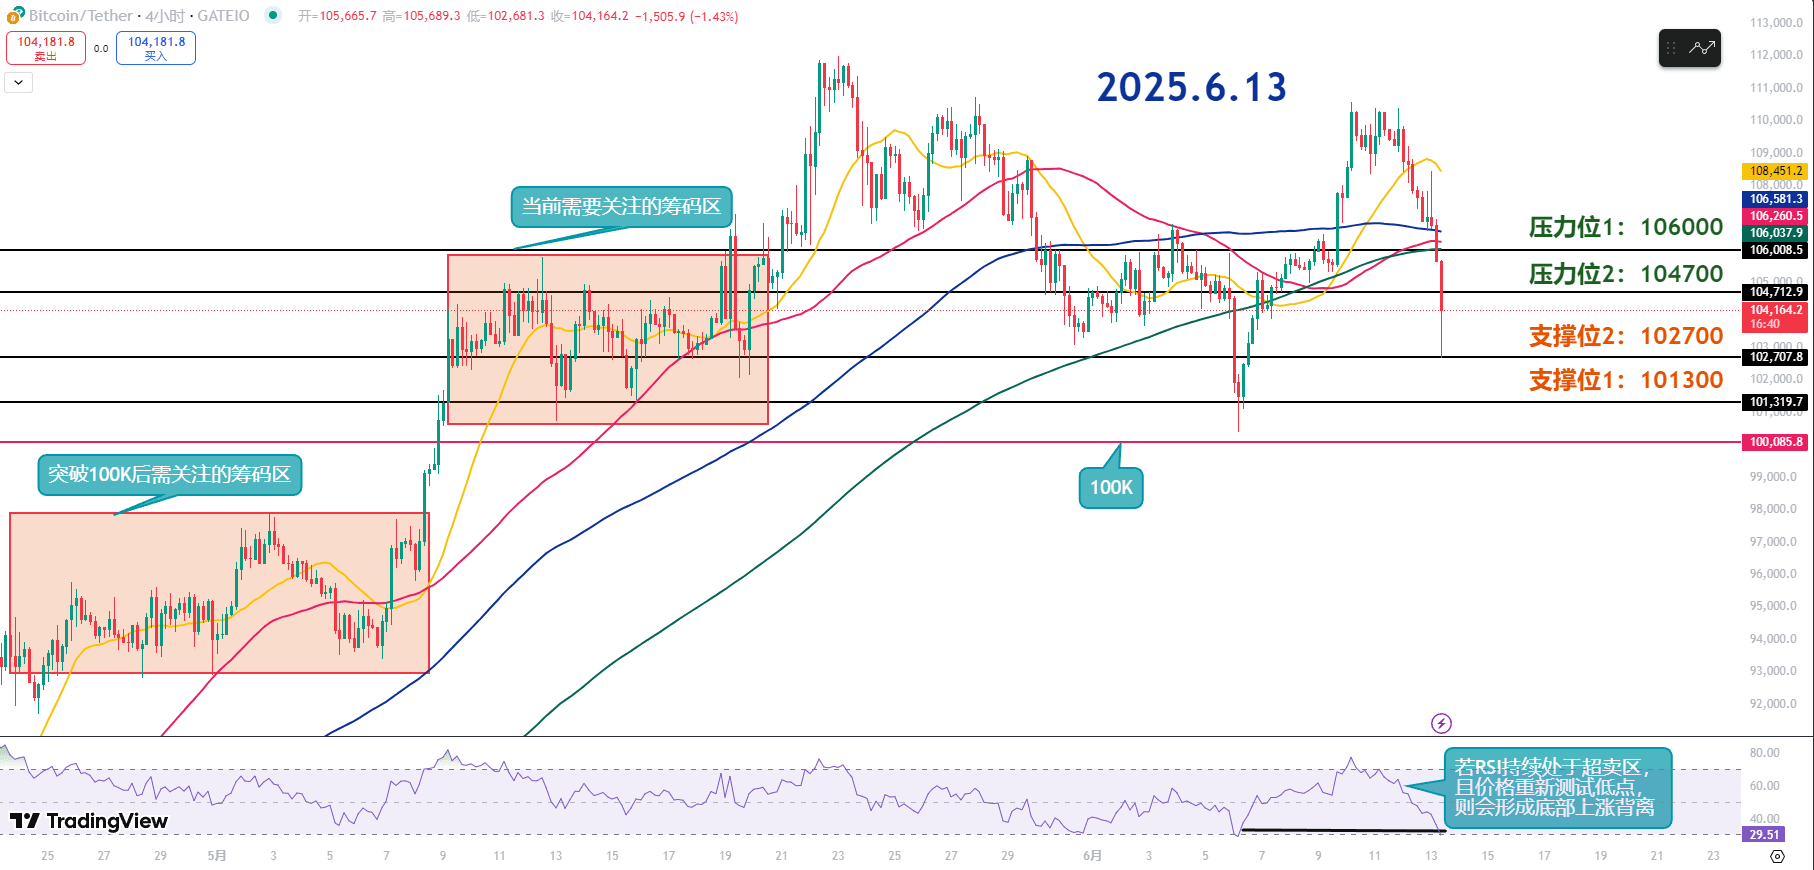
Resistance level reference:
Second resistance level: 106000
First resistance level: 104700
Support level reference:
Second support level: 102700
First support level: 101300
The current market is in a downtrend channel; short-term focus on whether the RSI enters the oversold zone (RSI less than 30) and pay attention to whether a hidden bullish divergence occurs. In simple terms, when the price creates a low, the RSI does not sync with a new low. Once a confirmation signal appears, consider accumulating positions in batches at lower prices.
The first resistance at 104700 is a high point formed during multiple declines, belonging to short-term strong resistance. To return to high levels, this position must be broken first.
The second resistance around 106K is a dense area of short to medium-term moving averages, making it stronger resistance. While it may be tested, typically after touching it, a new round of pullback will occur. Given the current difficulty of retesting 110K, the range of 104-106K can be set as a dense resistance area.
The first support at 102700 corresponds to the midsection of the historical transaction dense area and the lower edge of the shadow line, providing effective short-term support. If the RSI is oversold and shows divergence, a low buy can be attempted. The second support is the lower edge of the past transaction range and is also an important support. If the RSI reverses and confirms in this area, you can accumulate positions in batches.
6.13 Strategy by Shi Ye:
Long entry reference: accumulate long positions in the range of 101300-102700, target: 104700-106000
Short entry reference: not currently referenced
If you truly want to learn something from a blogger, you need to keep following them, rather than jumping to conclusions after just a few market views. This market is filled with performance players; today they screenshot long positions, and tomorrow they summarize short positions, making it seem like they always catch tops and bottoms, but in reality, it’s all hindsight. A truly worthy blogger will have a trading logic that is consistent, coherent, and withstands scrutiny, not jumping in when the market moves. Don’t be blinded by flashy data and out-of-context screenshots; long-term observation and deep understanding are needed to distinguish who is a thinker and who is a dreamer!

