1. Daily analysis: High inducement, top embryo gradually appears
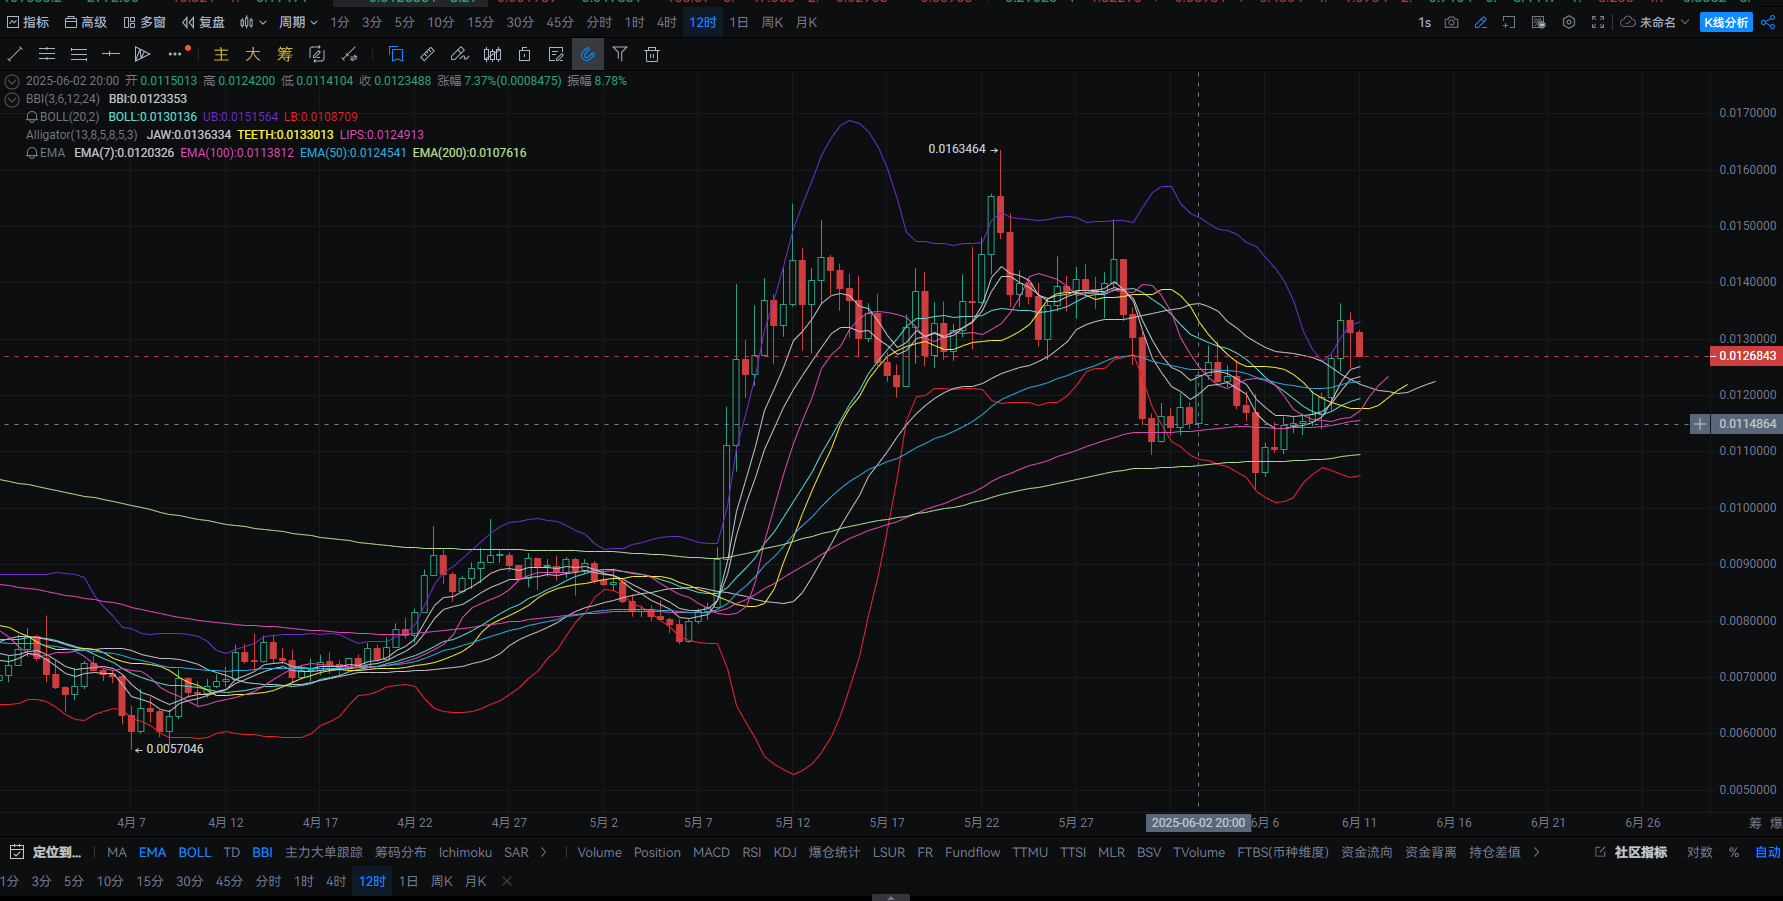
K-line pattern: Yesterday's strong bullish attack, yesterday closed with a long upper shadow 'inverted hammer', today's small bearish candle has engulfed yesterday's lower shadow, a typical top formation signal;
Bollinger Bands: The upper band pressure is effective, the daily price has failed to stabilize above the BOLL upper band (0.0137), and upward momentum is gradually weakening;
Moving Average System: EMA7/EMA20 is sharply rising, short-term still in bullish arrangement, but the price has obviously deviated from the moving average and needs to pull back;
MACD: Bullish red bars weaken, indicating top divergence risk. Once the death cross is confirmed, the daily line will enter a mid-term correction period.
The daily line is at the end of an upward trend, the top pattern is taking shape, and if it breaks below EMA7 or the Bollinger middle band, bears may dominate the market.
2. Four-hour chart: High-level oscillation weakens, short-selling signals strengthen
K-line structure: Clearly visible top 'tower' structure, currently in a bearish engulfing downward phase, the top has been established;
Bollinger Bands: The narrow opening is starting to crack downwards, and the price is approaching the middle band. Once breached, it will quickly test the lower band support;
Moving Average Status: EMA7 (0.01255) has been broken, EMA20 (0.01236) is the short-term bullish-bearish boundary;
MACD: Death cross is about to form, bearish momentum is amplifying, and the signal for a significant downward move is highly confirmed.
The 4-hour chart has entered a short-term reversal phase, high-level divergence has turned into active selling pressure, and bears are gradually taking control.

3. One-hour chart: High-level selling pressure is evident, rebounds are weak
K-line pattern: After a failed high, three consecutive bearish candles suppress, forming a 'head and shoulders' right shoulder pattern;
Moving Average System: EMA7/EMA20 death cross, price is running below all short-term moving averages;
Bollinger Bands: The middle band is sloping downwards, and the price is about to approach the lower band, indicating that the downward space has not yet been released;
MACD: Death cross is expanding, green momentum bars are continuously amplifying, short-term downward pressure is strong. The small cycle is accelerating in correction, bearish sentiment dominates, rebound space is limited, suitable for shorting at high levels.

4. PEPE shorting strategy recommendation (current price: 0.01270)
Project Value
Opening Position: 0.01275
First Zhi Ying: 0.01253
Second Zhi Ying: 0.01234
Zhi Loss Position: 0.01292


