Hello everyone, welcome to watch Wanqian talk about trends. We focus exclusively on the trends of mainstream coins. The study of left and right side trading models, as well as the understanding of medium to long-term and short-term fluctuations, will continuously be updated. Thank you for your attention. When there are people laughing in the cryptocurrency world, there will be those crying; I hope everyone is in the former group!
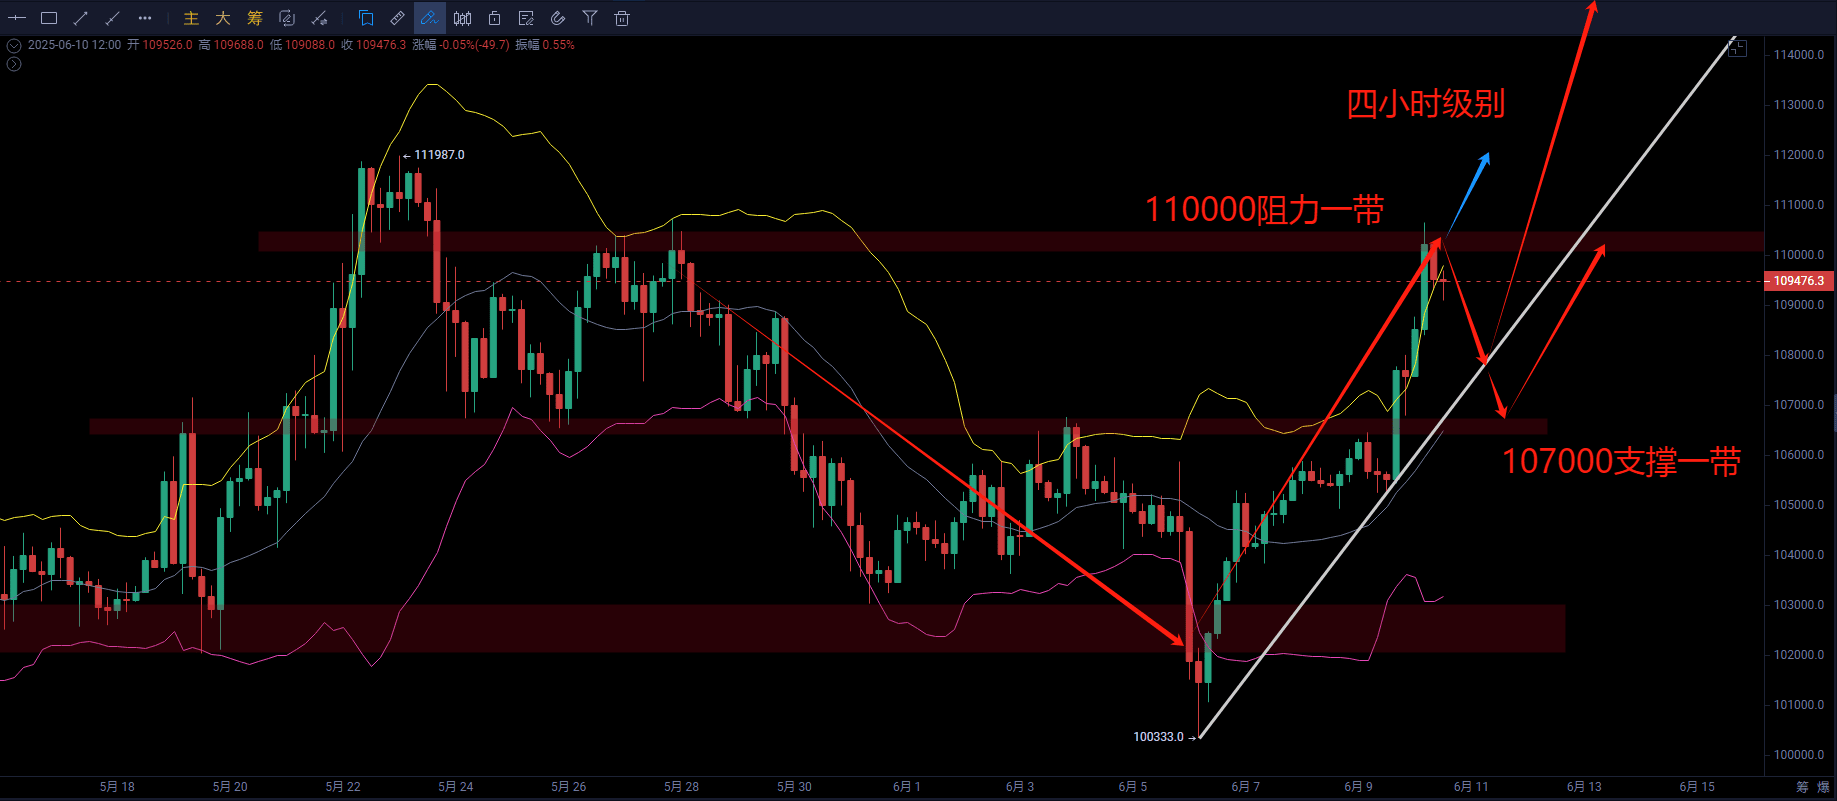
From a technical analysis perspective, the previous high of 110,000 for Bitcoin constitutes a clear four-hour level resistance. After the price accurately touched this position, it showed a bearish trend. Reflecting on the previous strategy, if yesterday's bullish candle is considered a valid breakout, one could choose to enter directly after the breakout; or more conservatively, wait for the price to pull back to the middle of the range and enter when a bearish candle appears, both of which could yield considerable profits within the range of 107,000 to 110,000. The current price is testing the previous high and has pulled back. If there are signs of a stable retracement afterwards, there are still opportunities to go long from a technical standpoint. Observing from the daily level, yesterday's bullish candle demonstrated strong bullish momentum. If today's trend continues with a bullish close, it may form a lower shadow structure. If a large bullish candle appears again, there is a possibility of hitting a historical new high.
From a technical analysis perspective, the previous high of 110,000 for Bitcoin constitutes a clear four-hour level resistance. After the price accurately touched this position, it showed a bearish trend. Reflecting on the previous strategy, if yesterday's bullish candle is considered a valid breakout, one could choose to enter directly after the breakout; or more conservatively, wait for the price to pull back to the middle of the range and enter when a bearish candle appears, both of which could yield considerable profits within the range of 107,000 to 110,000. The current price is testing the previous high and has pulled back. If there are signs of a stable retracement afterwards, there are still opportunities to go long from a technical standpoint. Observing from the daily level, yesterday's bullish candle demonstrated strong bullish momentum. If today's trend continues with a bullish close, it may form a lower shadow structure. If a large bullish candle appears again, there is a possibility of hitting a historical new high.
In the cryptocurrency world, it's a competition between retail investors and market makers. If you don't have cutting-edge news or first-hand information, your starting line isn't equal. All the hard work is just to help more people learn to trade and be self-sufficient!
The article is time-sensitive; the market changes significantly, and actual trading takes precedence. The above suggestions are for reference only!
Investing carries risks; entering the market requires caution.


