📊 1. Intraday price trend: Key support level repeatedly tested
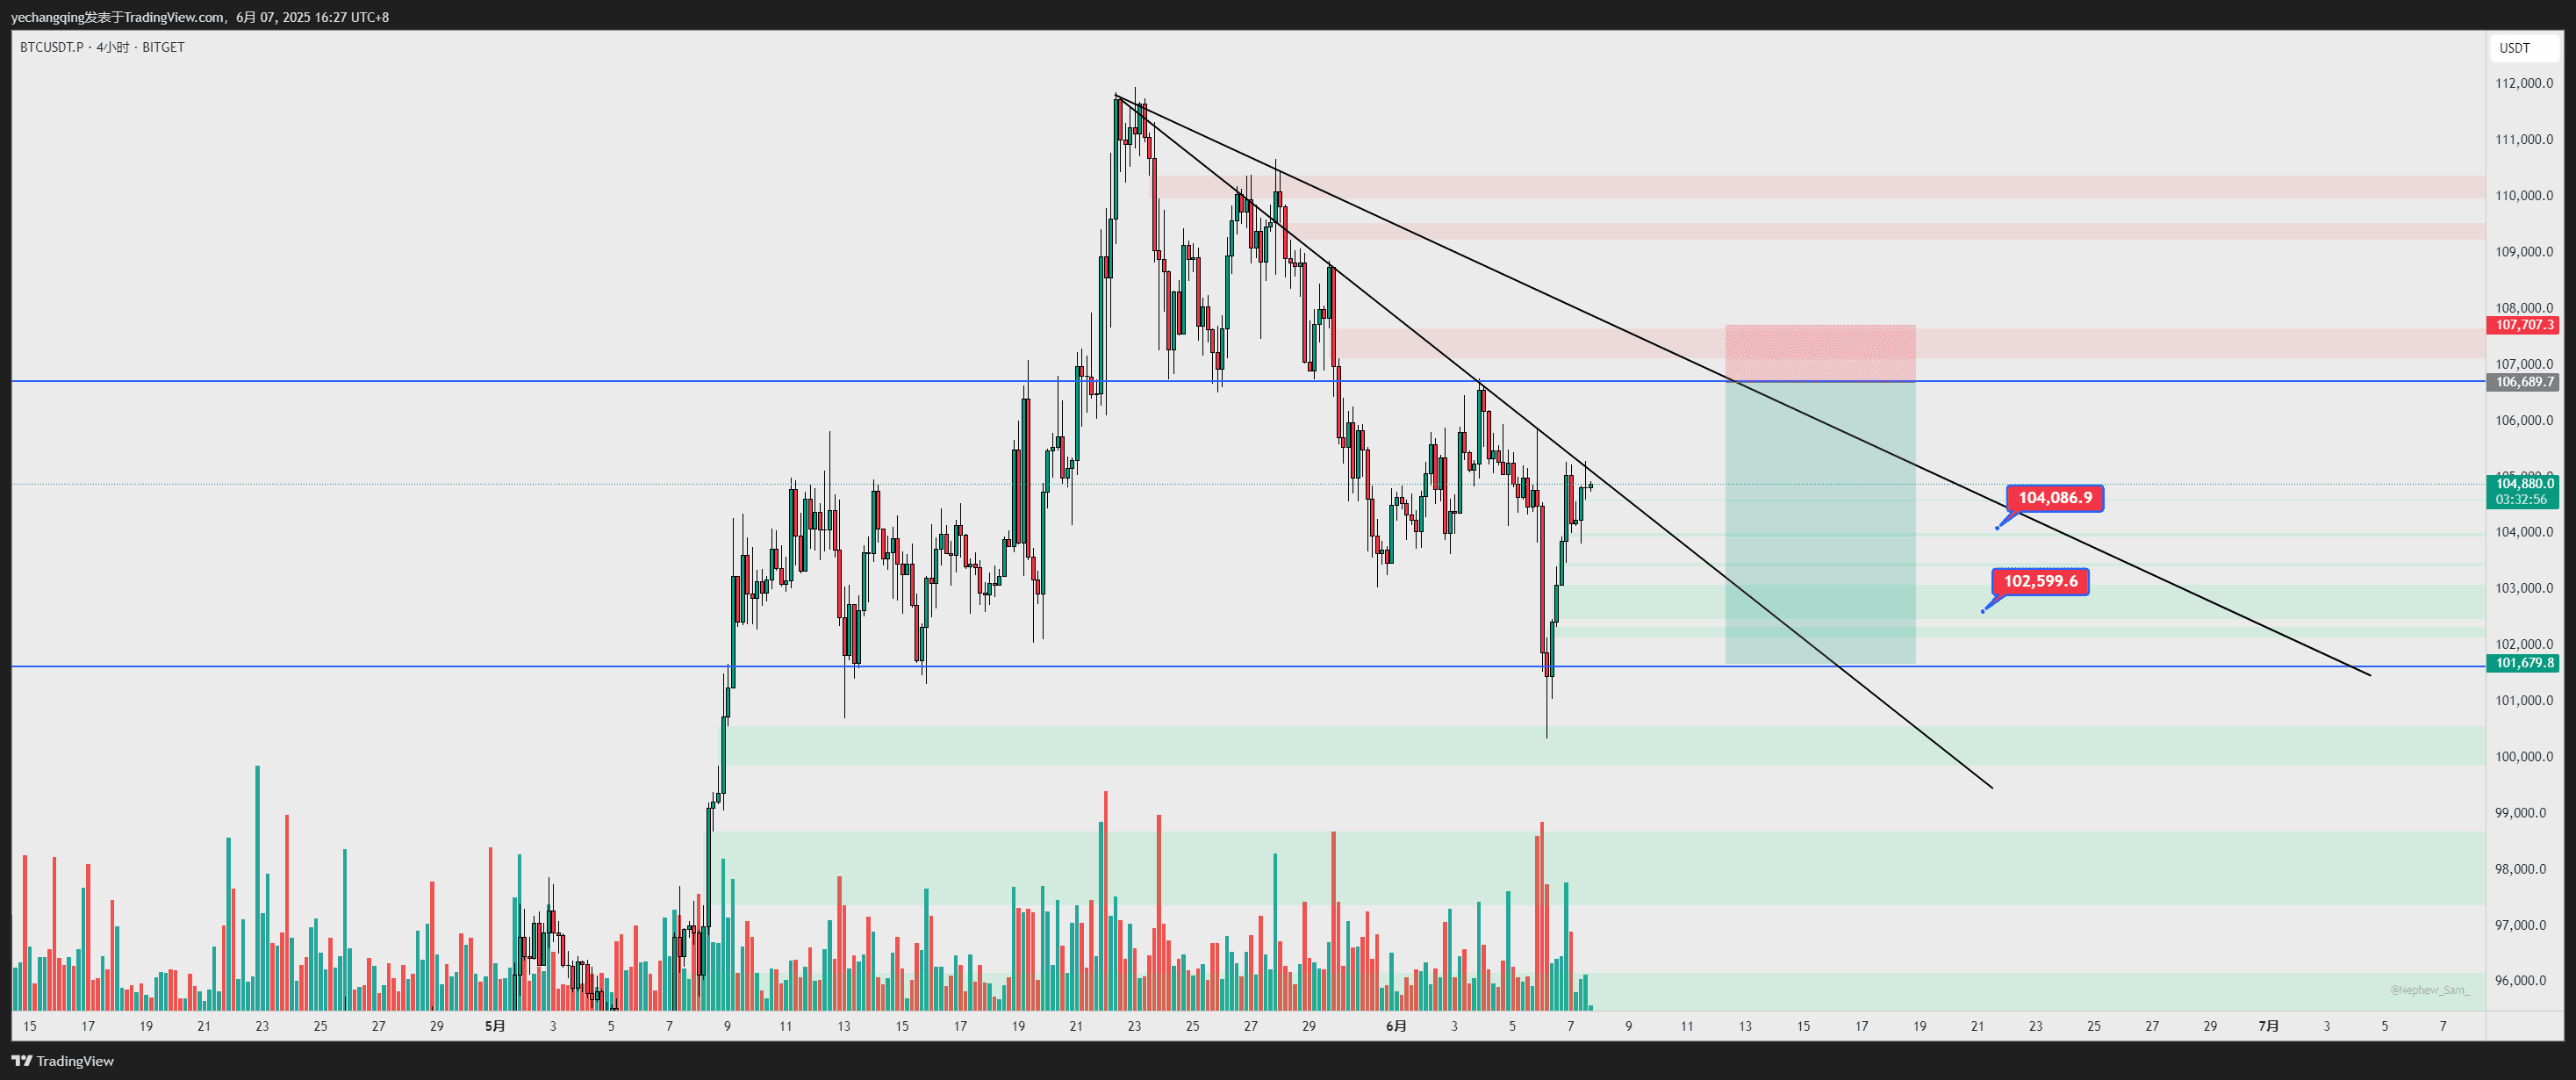
Current price: Bitcoin currently at $103,985 (as of press time), 24-hour increase of 2.695%, but intraday volatility range has expanded to $102,500-$106,000, testing $103,000 weekly support multiple times 38.
Key technical level:
Support level:
$103,000 (weekly EMA30 and psychological level, dense area of on-chain buy orders) - if the entity breaks below, it may trigger panic selling;
$100,000-$97,000 (long-term trend watershed, sovereign-level capital support area) 17.
Resistance level:
$107,500 (MA7 moving average and upper edge of descending triangle, breakout requires volume);
$110,000-$112,000 (previous high resistance level, breakout difficulty high) 14.
Indicator signals diverging:
Bearish signal: Daily MA7 crosses below MA30 forming a 'death cross', MACD green bars expand, Bollinger Bands lower band opens;
Rebound opportunity: 4-hour chart shows bullish divergence (price makes new low while RSI rises), RSI (34) close to oversold range, if holds $103,000 or triggers technical rebound 81.
⚖️ 2. Comparison of long and short forces: macro policy vs technical pattern betting
Factors bullish support bearish pressure technical Wyckoff accumulation pattern indicates breakout (target $124,955-$130,000) 1
Seasonal patterns (historical average increase of 140%-160% in June) 4 potential head and shoulders top pattern (break below neck line target $96,000) 8
Volatility has dropped to a six-month low ('turtle market' waiting to be triggered) 2 liquidity Coinbase premium has been positive for 20 consecutive days (institutional buying on dips) 1
FTX debt repayment of $5 billion may flow back to the crypto market 7 high leverage risk (unsettled contracts across the network $48 billion, 65% are high leverage) 2
Exchange BTC inventory has dropped to a new low since 2018, flash crash risk rises macro aspect US strategic Bitcoin reserves launched (reinforcing 'digital gold' attributes) 1 Trump tariffs undecided (July 9 ruling) 5
Fed rate cut expectations postponed (if PCE inflation exceeds expectations, it will strengthen hawkish stance) 7
📉 3. Core contradiction in technical aspect: Wyckoff accumulation vs head and shoulders top risk
Wyckoff bullish signal:
The current price is forming an accumulation pattern near $106,400. If it holds this position, it may enter the 'marked rising phase' (E phase) after June 7 (today), target $124,955-$130,000 1.
Golden cross (short-term moving average crosses above long-term moving average) strengthens breakout expectations, history shows this signal often accompanies long-term rises 1.
Head and shoulders top reversal risk:
Left shoulder ($104,063), head ($111,800), right shoulder ($106,700) pattern formed. If it breaks below the neck line ($103,000), downward target points to $96,000 8.
Bollinger Bands frequently touching the upper band + 'three push-up' pattern, indicating bullish momentum exhaustion 8.
🛡️ 4. Operational strategy: range bands and breakout response plan
Short-term trading strategy (strictly adhere to risk control)
Direction entry range, stop loss target logic based on light position attempt long $102,500-$103,000, stop loss $101,500, target $106,000-$107,500 betting on oversold rebound and Wyckoff breakout precursor, short at high $106,500-$107,000, stop loss $107,800, $104,000-$103,000 capture head and shoulders top pattern downward momentum
Breakout response plan
Upward breakout: If volume stabilizes above $107,500, chase long target $118,000-$124,955 (descending triangle + Wyckoff model resonance) 14.
Downward breakdown: If the entity breaks below $103,000, stop loss on long positions and reverse to short, target $100,000-$96,000 78.
⚠️ 5. Risk warning: three major catalysts and black swans
Macro data disturbances (today's focus):
21:30 UTC US PCE inflation data: If exceeds expectations (previous value 2.52%), it will suppress Fed rate cut expectations, Bitcoin may plummet to $101,000; if below expectations, it will boost breakout above $107,500 75.
Policy black swan:
Trump and Musk's conflicts become public (has triggered $324 million in long position liquidations) 3;
SEC delays decision on Ethereum ETF (July qualitative risk) 5.
Market linkage risk:
If Ethereum loses $2,500 (currently at $2,540), it may drag Bitcoin to test $100,000 3;
US stock volatility intensifies (S&P 500 records worst start in 2020), risk assets correlation reaches over 0.8 7.
💎 Comprehensive conclusion: Defensive discipline on the eve of directional choice
Today's core market contradiction is the confrontation between 'Wyckoff breakout momentum' and 'head and shoulders top breakdown risk', requiring flexible strategy adjustment based on key events:
✅ Bullish opportunity:
$103,000 support area light position layout (position ≤ 10%), strict stop loss $101,500, betting on technical rebound to $107,500;
Breakout confirmation condition: stabilize above $107,500 and PCE data is moderate, increase position target $118,000.
🛡️ Bearish logic:
Maintain short positions at high levels until a breakout above $107,500 is confirmed; stop loss above $108,000;
Breakdown trigger condition: break below $103,000 to chase shorts, target $100,000-$96,000.
🔍 Today's observation priority:
21:30 UTC US PCE inflation data (determines the probability of the Fed's September interest rate cut);
Can ETH hold $2,500 and the volatility of CME futures roll 27;
Large on-chain fluctuations (accumulation of $5.8 billion orders at $104,000, hidden breakout trigger)