
📉 1. Core signal analysis of technical aspects
1. Daily level: a breach and pullback, but downward pressure has not been relieved.
• Price structure:
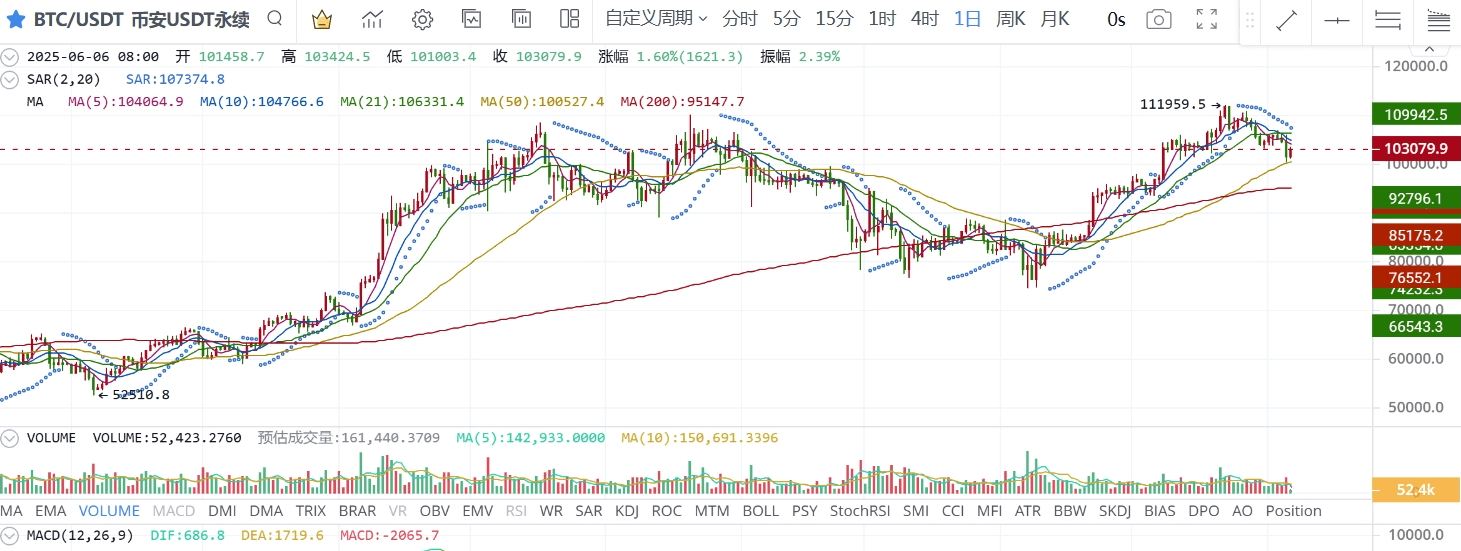
On June 6, closed at 103,079.9 USDT, with a single-day increase of +1.68%, but still within the 100,000-105,000 fluctuation range.
Key resistance: 105,000 (previous high dense area), 108,000 (MA50 moving average resistance).
Key support: 100,000 (psychological level), 95,000 (200-day moving average support).
• Contradictory signal indicators:
Bearish arrangement: MA (5/10/21/50) moving averages all press down (MA5: 184,664 > closing price 103,079), presenting a standard bear market structure.
Local rebound momentum: MACD green bars shorten, RSI (45) exits the oversold zone, indicating a demand for technical repair.
Daily conclusion: the rebound has not broken through 105,000, still regarded as a downward continuation.
2. Hourly level: volume exhaustion, change in trend imminent.
• Price action:
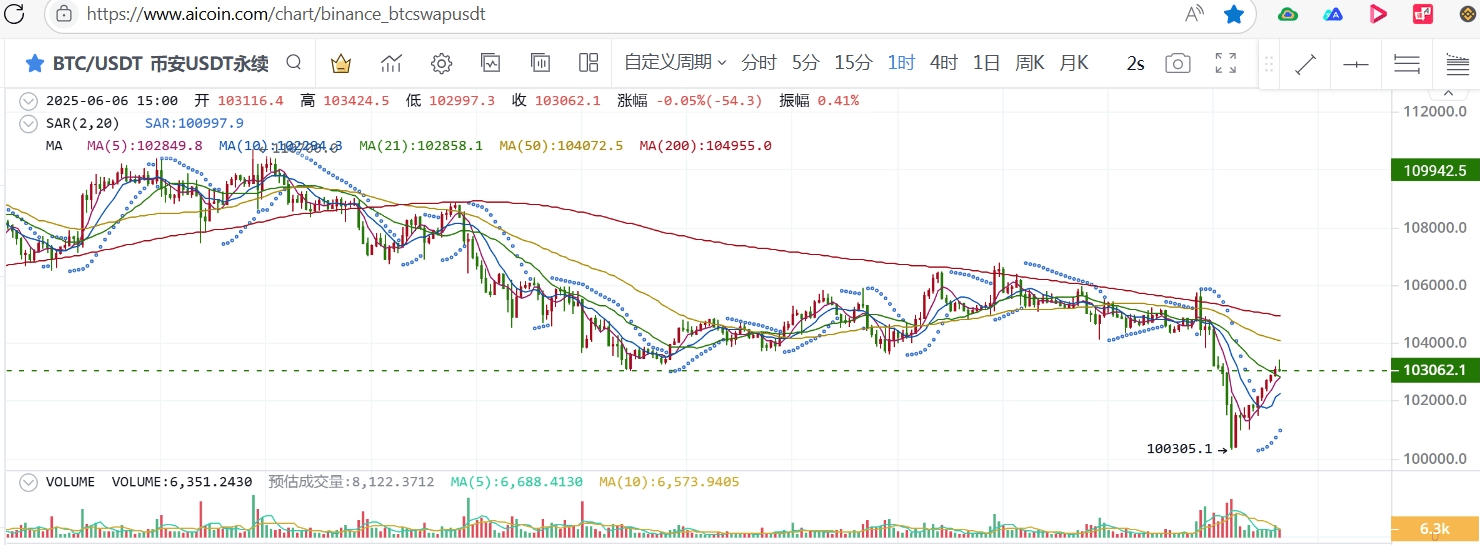
On June 5, 15:00 to June 6, the amplitude was only 0.41%, the volatility reached a new low for the month, presenting a 'contraction triangle' pattern.
Short-term resistance 103,400 (previous high), support 102,800 (hourly MA5).
• Volume warning:
Hourly trading volume 16,351 BTC, far below the average of 20,000 BTC, the rebound lacks financial support.
Volume-price divergence: volume decreases during the price rebound, confirming weak bullish momentum.
Hourly conclusion: if it loses 102,800, it will trigger short-term selling pressure, targeting 101,000.
